


Spot Bitcoin ETFs Experience One Week of Outflows: What Happened Last Time?
Spot Bitcoin ETFs have entered a troubling trend, recording outflows for an entire week straight. These outflows have coincided with the decline in Bitcoin’s price, suggesting that institutional sell-offs and miner sell-offs might be driving the trend. With seven consecutive days of outflows now completed, this report examines what happened the last time outflows were this high.
Spot Bitcoin ETFs Lose Money for 7 Straight Days
According to data from Coinglass, Spot Bitcoin ETFs have now marked their seventh consecutive day of outflows. These outflows have averaged around $100 million daily, resulting in approximately $1.2 billion being pulled from the funds so far.
While the current trend is concerning, it’s not the first time Spot Bitcoin ETFs have experienced such a streak. In April-May 2024, these funds endured seven consecutive days of outflows, to an even greater extent than now. The largest single-day outflow was recorded on May 1, 2024, when $563.7 million was withdrawn.
This previous trend offers insights into the current situation and potential future developments. In May, after seven days of consecutive outflows, the funds saw a brief recovery with two days of inflows before outflows resumed. However, this was the beginning of a more significant recovery. Starting from May 13, inflows accelerated, with 19 consecutive days of inflows setting a new record.
If this trend repeats, Spot Bitcoin ETFs could see a turnaround soon, particularly with Bitcoin’s price recovery. A repeat of the May trend could trigger substantial inflows, driving prices higher as demand increases.
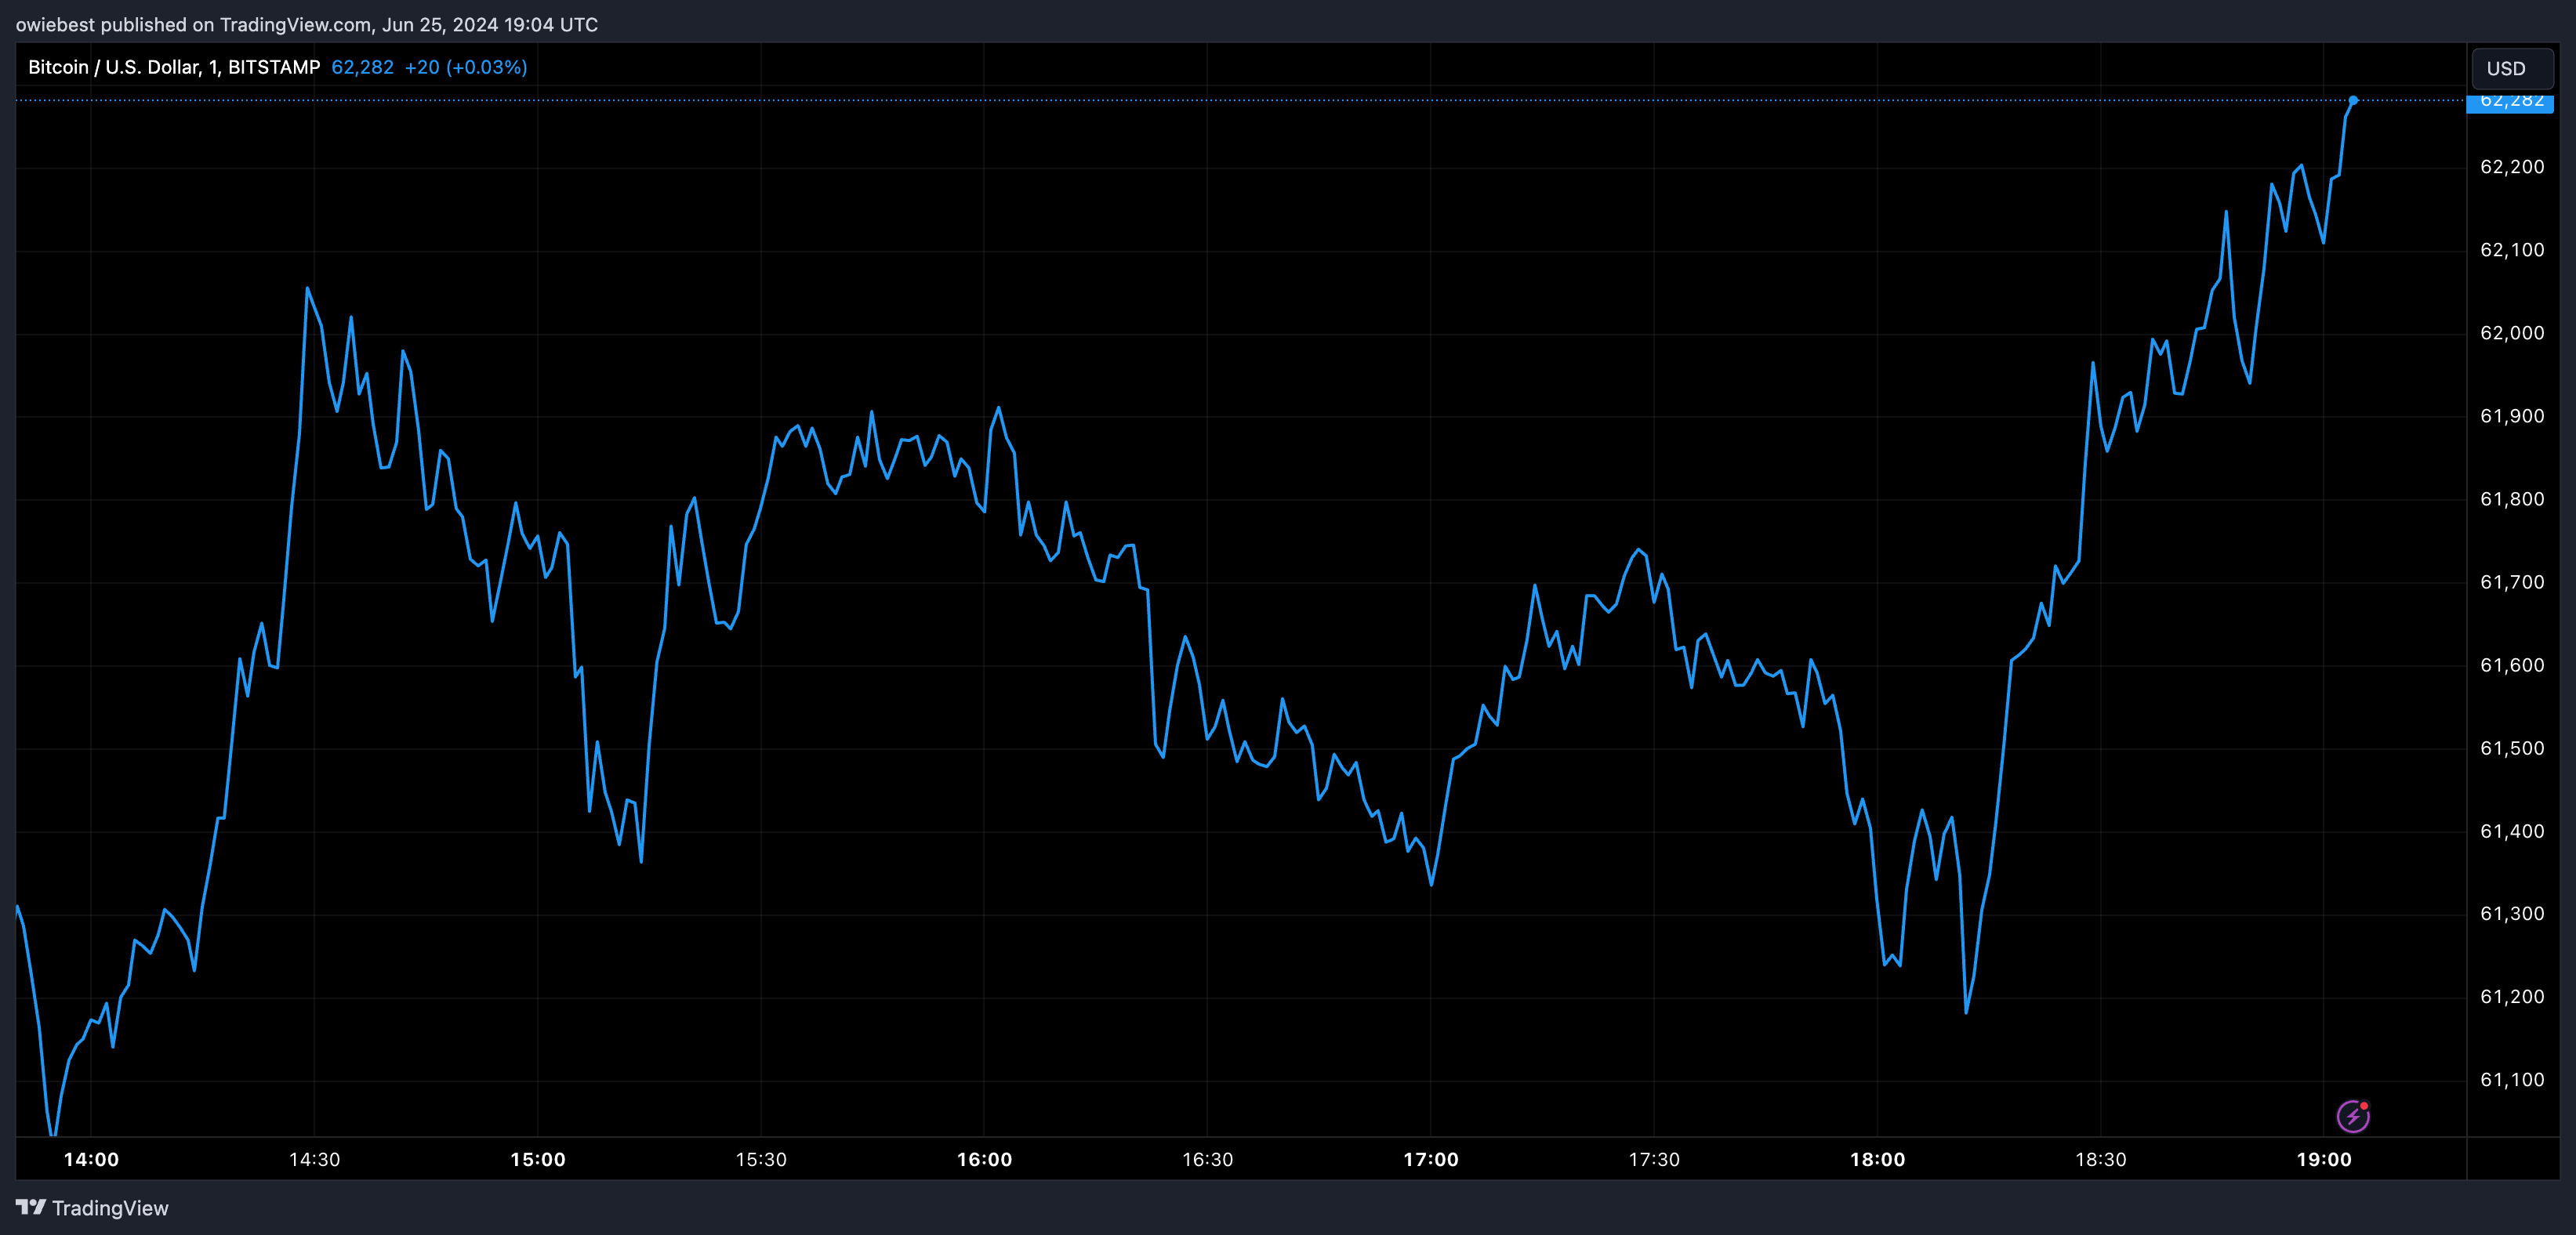
BTC on the Charts
Despite dropping to $60,000, Bitcoin is still trading well above its 200-day moving average of $50,613, suggesting a bullish long-term outlook as investors continue to hold rather than sell.
However, in shorter timeframes, Bitcoin is underperforming, falling below its 50-day and 100-day moving averages of $65,403 and $63,928, respectively, which are crucial for short and mid-term performance.
On the daily chart, Bitcoin is starting to show some upside. Its daily trading volume has increased by 35%, and its price has recovered above the $61,000 resistance once again.
Featured image created with Dall.E, chart from Tradingview.com