


Bitcoin initiated a new downtrend after encountering resistance around the $62,000 mark. With BTC now below $61,000 and the 100-hourly Simple Moving Average, the risk of further declines looms, especially if it breaches the crucial $60,000 support level. The recent hourly chart of the BTC/USD pair from Kraken indicates a break below a bearish flag pattern, with support previously near $60,950. Should the price maintain its position below $60,000, it could gather bearish momentum.
Bitcoin’s Price Indicates a Breakdown
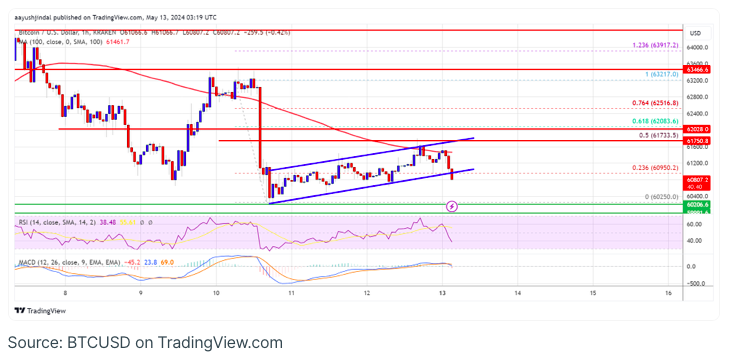
Bitcoin’s price discovered support near the $60,250 region and initiated a recovery phase. It managed to surpass the 23.6% Fibonacci retracement level of the downward trajectory from the $63,217 peak to the $60,250 low.
However, bears exerted pressure around the $61,800 resistance area, defending the 50% Fibonacci retracement level of the aforementioned downward move. Consequently, a fresh bearish response emerged below the $61,200 support area.
On the hourly chart of the BTC/USD pair, a bearish flag pattern break occurred with support around $60,950. Presently, Bitcoin is trading beneath both $61,000 and the 100-hourly Simple Moving Average.
Immediate resistance resides near the $61,200 mark. The initial significant resistance might be at $62,000 or the 100-hourly Simple Moving Average. Subsequently, the next notable resistance level could be at $62,500. A definitive breakthrough above the $62,500 resistance could propel the price upwards.
Currently, the primary resistance level stands at $63,500. Should there be a decisive close above this resistance zone, the price might extend its upward trajectory. In such a scenario, the price could target $65,000.
Is BTC Facing Further Downward Pressure?
Should Bitcoin fail to surpass the $61,200 resistance zone, it could extend its downward movement. Immediate support on the downside is expected near the $60,500 mark.
The first significant support level lies at $60,000. A close below this level might initiate a decline towards $58,500. Further losses could potentially lead the price towards the $56,650 support area in the short term.
Technical Indicators:
Hourly MACD – The MACD is currently showing momentum in the bearish zone.
Hourly RSI (Relative Strength Index) – The RSI for BTC/USD is now below the 50 level.
Key Support Levels – $60,500, followed by $60,000.
Key Resistance Levels – $61,200, $62,200, and $62,500.