


As of May 3, 2024, Bitcoin’s price is $59,142, with an intraday range from $57,789 to $60,000. The leading cryptocurrency holds a market capitalization of $1.15 trillion, with a trading volume of $28.43 billion within the past 24 hours.
Bitcoin
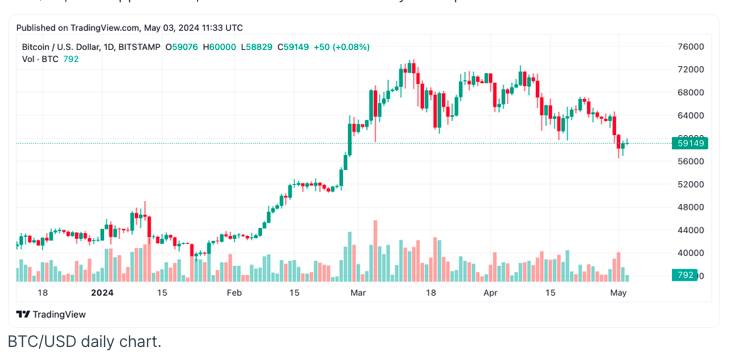
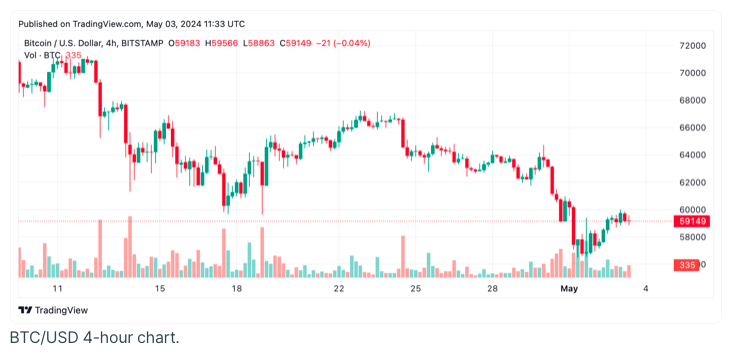
Bitcoin’s daily chart analysis indicates a persistent bearish trend, with the price sliding from a peak of $72,750 on April 7 to a support level around $56,500 by April 30. The bearish momentum is evident in the increased trading volume accompanying downward price movements, signaling the possibility of further declines if this support level gives way. On the 4-hour chart, Bitcoin demonstrates resilience at the $56,500 support level, though recovery efforts have been relatively subdued.
Despite minor bullish spikes, the weak buying volumes suggest a lack of commitment among buyers to turn the trend around. The 1-hour chart provides a detailed view of intraday activity, illustrating a slight upward movement as prices bounce from $57,062 to around $59,500. However, the choppy fluctuations suggest elevated volatility and trader uncertainty. For short-term traders, strategic entry and exit around key support and resistance levels—such as $57,000 and $59,500—might offer an edge, especially if momentum indicators shift in their favor.
Currently, the oscillators offer a mixed signal: the relative strength index (RSI) and Stochastic indicate neutrality, while the Commodity Channel Index (CCI) and momentum oscillators suggest possible bullish opportunities. However, caution is warranted as the moving average convergence/divergence (MACD) points to a bearish tone, reflecting the broader downward trends visible in the overall chart patterns.
When assessing moving averages (MAs), the outlook is largely bearish, with most short to mid-term averages indicating a downward sentiment. Interestingly, both the 200-day exponential and simple moving averages (EMA & SMA) suggest a hint of bullishness, providing some hope for long-term traders that a potential bottom might be forming at these levels.
Bull Verdict:
The present resilience at key support levels, along with encouraging signals from long-term moving averages and specific oscillators, indicates that Bitcoin might be on the verge of a rebound. If buyers can maintain higher volumes and break through resistance barriers, it could pave the way for a bullish trend. Traders should monitor consistent bullish patterns and rising trading volumes as signs of increasing momentum.
Bearish Outlook:
Despite occasional signs of recovery, the prevailing bearish signals across various time frames and technical charts suggest a continued risk of further declines in Bitcoin’s price. The notable trading volume associated with downward price movements, combined with a preponderance of sell signals in shorter-term moving averages, indicates that the market might not have hit bottom yet. Traders should exercise caution, potentially considering asset protection strategies or planning careful exits if the downward trends persist.