

 Price Rebounds Sharply: A Return to Bullish Territory?")
Ethereum (ETH) recently found support at the 0.382 Fibonacci retracement level, near $2,867, sparking a bullish rebound. This leads to a critical question: Could this signal the end of the recent correction?
ETH has experienced a notable correction over the past few weeks. However, the latest rebound from this key support area indicates a possible trend reversal, hinting that the correction might be nearing its conclusion.
Ethereum’s Swift Bounce from 0.382 Fibonacci Support at $2,867

Additionally, the daily chart’s Exponential Moving Averages (EMAs) continue to display a golden crossover, suggesting a bullish trend in the short to medium term. The bullish crossover between the Moving Average Convergence/Divergence (MACD) lines and the upward trajectory of the MACD histogram in recent days further reinforce this positive outlook.
On the other hand, the Relative Strength Index (RSI) remains neutral, indicating a lack of clear bullish or bearish momentum.
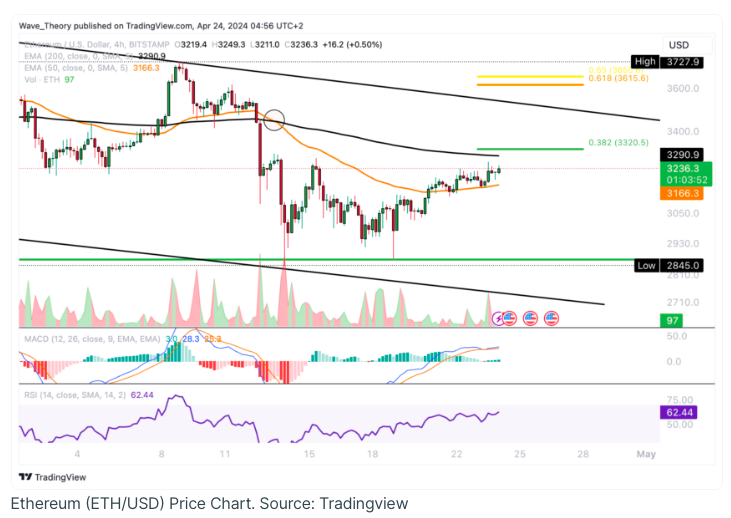
Ethereum Confronts a Death Cross on the 4-Hour Chart
A death cross recently appeared on Ethereum’s 4-hour chart, reinforcing a bearish outlook in the short term. However, if Ethereum maintains its upward momentum and breaks through the 0.382 Fibonacci resistance level near $3,320, the Exponential Moving Averages (EMAs) could flip to a golden crossover, signaling a shift towards a bullish trend.
The MACD Lines Bearishly Cross on the Weekly Chart
On Ethereum’s weekly chart, a bearish crossover of the MACD lines and a downward trend in the MACD histogram over the past few weeks point to a continuing bearish sentiment.
Despite Ethereum falling by about 30.5% from its peak seven weeks ago, a recent bounce from the 0.382 Fibonacci support level around $2,867 has driven a recovery of about 15%.
Nevertheless, the ongoing support from the Exponential Moving Averages (EMAs) and the neutral stance of the Relative Strength Index (RSI) suggest a cautiously optimistic outlook for Ethereum at this point.
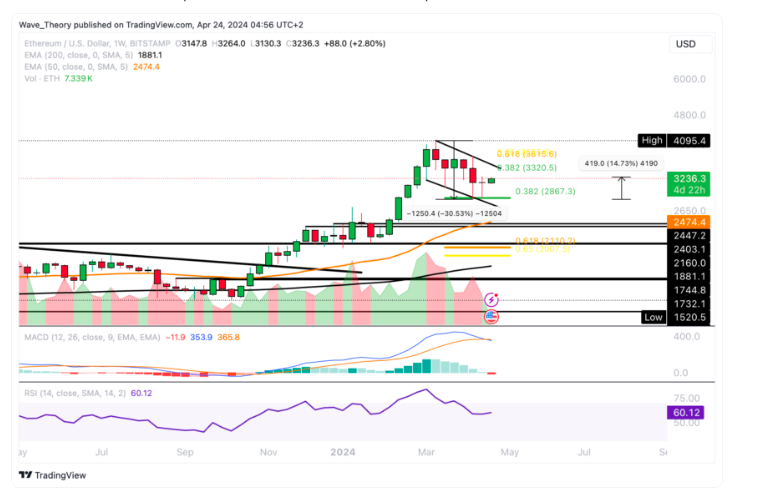
Further upward movement and price recovery for Ethereum appears likely. However, a strong bullish signal would only emerge if Ethereum breaks through the golden ratio, which is around $3,650.
Ethereum Drops 23.7%: Analyzing This Month’s Decline
This month, Ethereum has seen a drop of about 23.7%, suggesting that the correction may have run its course. Moreover, the Moving Average Convergence/Divergence (MACD) indicators on the monthly chart do not signal any bearish trends.
Instead, the MACD lines continue to point towards a bullish trajectory, the MACD histogram shows upward momentum, and the Relative Strength Index (RSI) stays within neutral territory. In the medium term, if Ethereum falls below the 0.382 Fibonacci support level, the key support at the golden ratio is expected to be around $2,050.
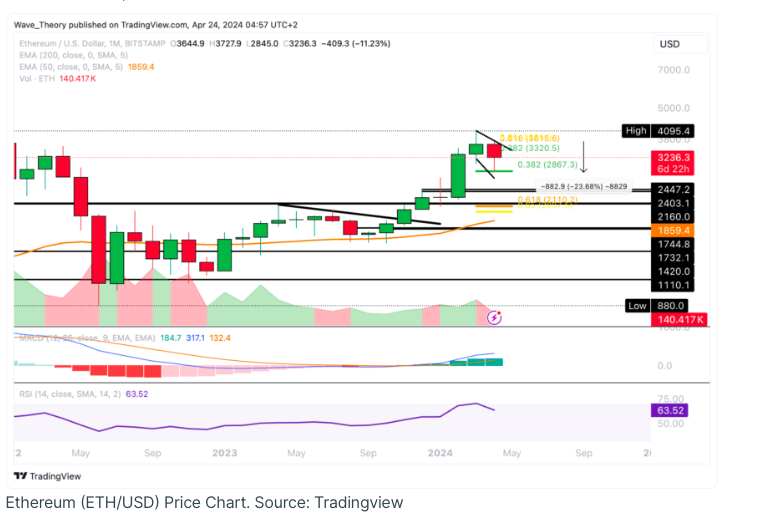
Ethereum (ETH/USD) Price Chart. Source: TradingView
Keeping Ethereum above this level is vital for maintaining its bullish trajectory. Should Ethereum fall below this point, substantial support could emerge, likely around the 50-month Exponential Moving Average (EMA) at approximately $1,860.
Ethereum vs. Bitcoin: ETH’s Consistent Downward Trend
Ethereum’s price relative to Bitcoin continues to exhibit a bearish trend, with notable support at around 0.043 BTC. Ethereum is now within about 3.5% of this critical support level. Additionally, the MACD histogram has shown a downward trend this month, indicating further bearish momentum.
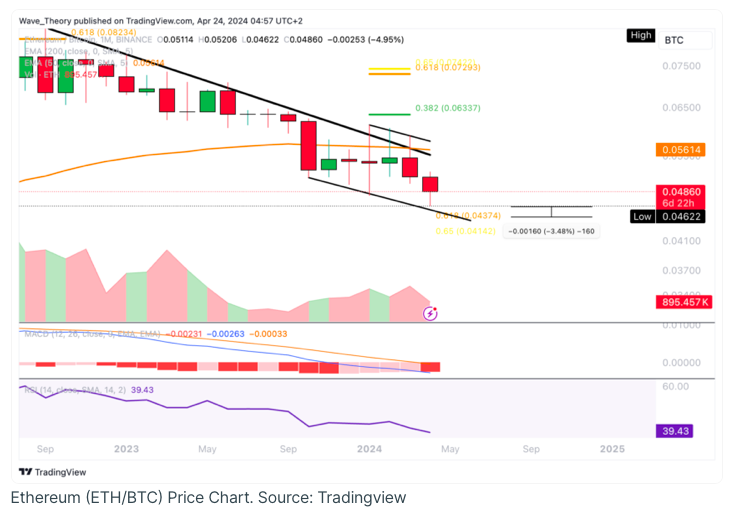
The MACD lines have already formed a bearish crossover, and the Relative Strength Index (RSI) is nearing oversold territory. This suggests that Ethereum might experience a bullish rebound at the golden ratio support around 0.043 BTC. However, if Ethereum manages to recover, it could face resistance at the 50-month Exponential Moving Average (EMA), which is roughly at 0.05614 BTC.