

 Expect a Recovery Following a Sharp 30% Price Drop?")
Litecoin (LTC) is eyeing a rebound after enduring a bearish streak that confirmed a 30% drop. Yet, the extent of LTC’s potential recovery remains uncertain amid increasing investor involvement.
Bullish Signs Emerge for Litecoin
Litecoin’s price is poised for a potential bounce back, given the recent downturn it has faced. Both the Relative Strength Index (RSI) and Moving Average Convergence Divergence (MACD) are signaling positive prospects.
The RSI, gauging the pace and magnitude of price shifts, is on the cusp of surpassing the neutral line at 50.0, indicating a bullish trend. Meanwhile, the MACD is displaying increasing bullish momentum, suggesting a possible uptick in LTC’s recovery journey.
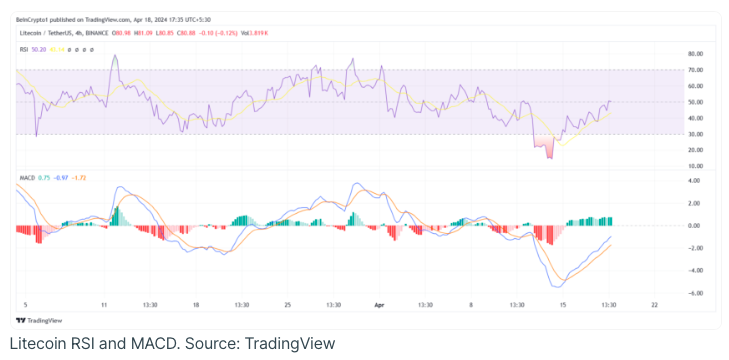
Litecoin’s RSI and MACD indicators, sourced from TradingView, are showing promising signs. Additionally, investors appear notably optimistic about a potential recovery. In the past 72 hours, there has been a notable uptick in total transaction volume on the Litecoin blockchain, marking the first surge in nearly a year.
Daily transactions totaling $9.27 billion were observed, reflecting a remarkable 168% increase from the average volume. This surge indicates a growing interest among LTC holders, potentially bolstering the anticipated recovery.

LTC Price Forecast: Will It Surpass $86 Next?
Litecoin is currently priced at $81, having rebounded from the recent local support level of $77 over the past few days. Presently, the altcoin is approaching the 38.2% Fibonacci Retracement level, situated between $115 and $57, which stands at $79. Surpassing this support level could potentially propel LTC towards breaching the $86 mark.
The $79 support floor aligns with the 50% Fibonacci level, and securing it as support would validate the onset of a recovery rally.
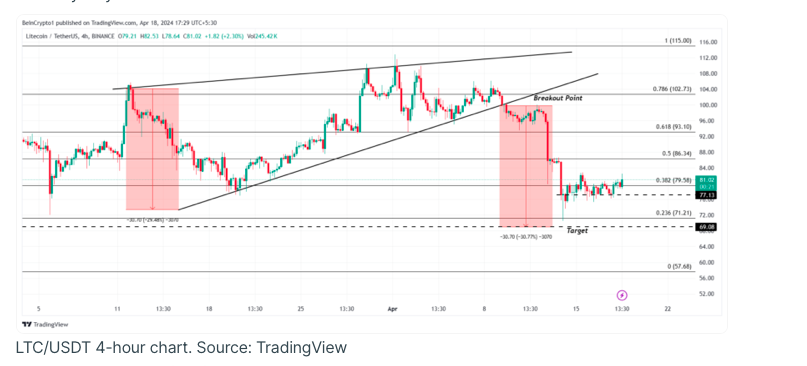
However, if LTC were to lose the support levels at $79 and $77, it could lead to a price decline, testing the 23.6% Fibonacci level at $71. Such a scenario would undermine the bearish outlook, potentially confirming and extending the 30% correction target associated with the rising wedge pattern.