


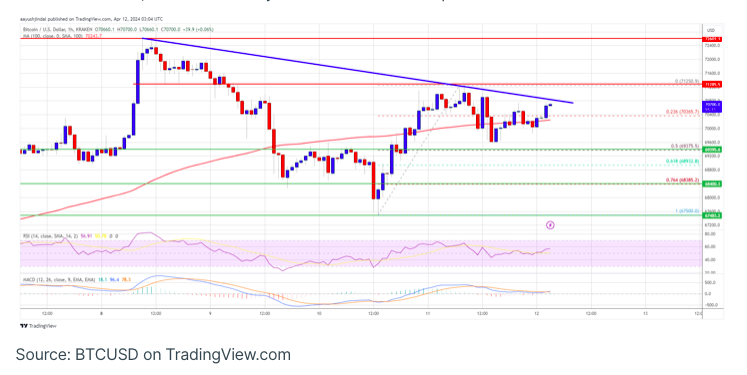
Bitcoin’s price maintains its gains above the $69,200 mark, with potential for bullish momentum if it surpasses resistance levels at $70,800 and $71,250. Currently, BTC is striving for an uptick beyond the $70,000 threshold, trading above both that mark and the 100-hourly Simple Moving Average. On the hourly chart of the BTC/USD pair from Kraken, a bearish trend line is taking shape, presenting resistance around $70,800. The pair’s bullish prospects increase upon breaking through the $71,250 resistance zone.
Bitcoin’s price is poised for another upward surge.
Bitcoin’s price made an attempt to climb higher above the $70,500 mark. Yet, BTC encountered resistance in its efforts to surpass the $71,200 and $71,400 levels.
A peak was reached at $71,250 before a downward correction ensued. This led to a drop below the $70,500 threshold, with the price slipping beneath the 23.6% Fibonacci retracement level of the upward movement from the $67,500 low to the $71,250 high.
Nevertheless, bullish activity persists above the $69,200 mark, hovering close to the 50% Fibonacci retracement level of the aforementioned upward movement.
Presently, Bitcoin is trading above $70,000 and the 100-hourly Simple Moving Average. Immediate resistance lies around the $70,800 level, compounded by a bearish trend line forming on the hourly chart of the BTC/USD pair, presenting resistance at $70,800.
The initial significant hurdle stands at $71,250, followed by the subsequent resistance level at $71,400. A decisive breakthrough above the $71,400 resistance area could propel the price further upward. In such a scenario, there’s potential for an ascent towards $72,600. The subsequent major resistance lies close to the $73,500 mark. Further gains could potentially steer Bitcoin towards the $75,000 resistance threshold in the short term.
Could BTC Experience Another Downturn?
Should Bitcoin fail to surpass the $71,250 resistance area, it could initiate another downward movement. Immediate support to the downside is anticipated around the $70,400 mark and the 100-hourly Simple Moving Average (SMA).
The primary support level stands at $69,350. A close below this level might trigger a descent towards the $68,500 mark. Further losses could potentially drive the price towards the $67,500 support region in the near future.
Technical Indicators:
Hourly MACD – The MACD is currently gaining momentum within the bullish zone.
Hourly RSI (Relative Strength Index) – The RSI for BTC/USD has surpassed the 50 level.
Key Support Levels – $70,400, followed by $69,350.
Key Resistance Levels – $70,800, $71,250, and $72,600.