


The decline in Ethereum’s price persisted, breaching the $3,320 support level. Currently, ETH is consolidating, and a potential upward movement may ensue upon surpassing the $3,320 mark.
Ethereum continued its bearish trajectory, falling beneath the critical $3,320 support level. It remains below both $3,400 and the 100-hourly Simple Moving Average. On the hourly chart of ETH/USD (data feed via Kraken), a significant bearish trend line is taking shape, indicating resistance around $3,320. Should the pair manage to surpass this resistance zone, it could gather bullish momentum.
Ethereum Encounters Resistance in Price Trajectory
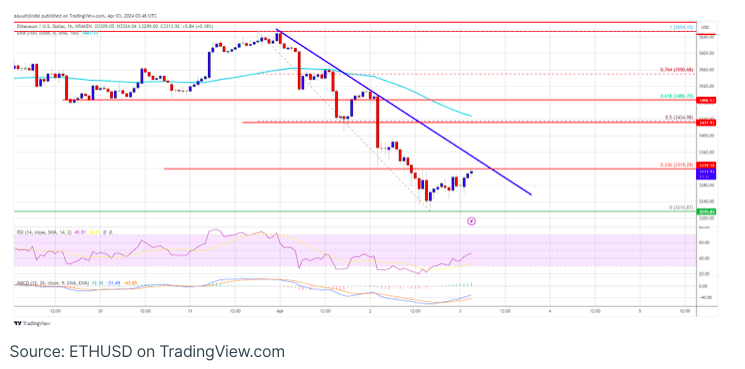
On the hourly timeframe, Ethereum’s price remained entrenched within a bearish zone, lingering below the $3,500 mark, akin to Bitcoin. The decline persisted below the critical $3,320 support level, with a dip even below $3,220, marking a low at $3,215 before initiating a recovery attempt. There was an uptick beyond the $3,250 threshold, testing the 23.6% Fibonacci retracement level of the downward movement from the $3,655 peak to the $3,215 trough.
Currently, Ethereum is trading beneath $3,400 and the 100-hourly Simple Moving Average, facing immediate resistance near the $3,320 level. Furthermore, a significant bearish trend line is forming with resistance around $3,320 on the ETH/USD hourly chart.
The primary resistance lies around the $3,350 level, followed by a pivotal hurdle at $3,440 or the 50% Fibonacci retracement level of the downward movement from the $3,655 peak to the $3,215 trough. Surpassing this level may pave the way for a test of the $3,500 threshold.
The following significant resistance is anticipated around the $3,550 threshold, indicating potential for Ethereum to gather bullish momentum. Should this scenario unfold, the price might ascend towards the $3,680 obstacle. Surpassing the $3,680 resistance level could propel Ethereum further towards the $3,780 resistance. Further gains may lead to a test of $3,850.
Yet Another Rejection for ETH?
Should Ethereum falter in surpassing the $3,320 resistance, it could face further downward movement. Initial support on the downside is expected near the $3,250 level.
The primary support zone lies around $3,220, followed by the key support level at $3,120. A decisive breach below the $3,120 support could trigger a decline towards $3,040. Subsequent losses may lead to a test of the $3,000 mark.
Technical Indicators:
Hourly MACD – The MACD for ETH/USD indicates a waning momentum in the bearish zone.
Hourly RSI – The RSI for ETH/USD has dipped below the 50 level.
Primary Support Level – $3,220
Primary Resistance Level – $3,320