


The decline in Bitcoin’s price persisted, breaching the $65,000 support zone. BTC is currently consolidating its losses and may endeavor a recovery towards $67,000.
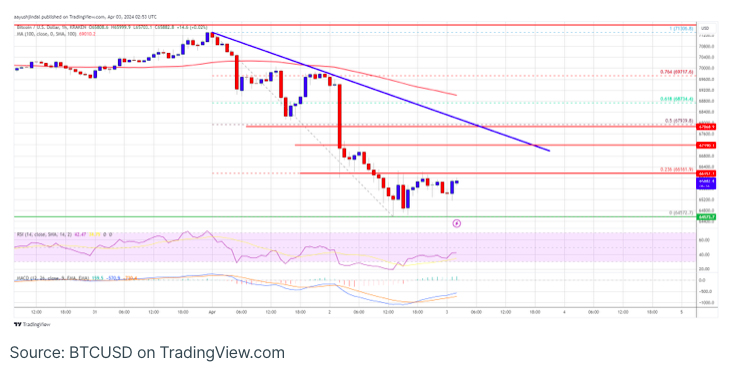
Bitcoin’s price continued its descent below both the $65,500 and $65,000 levels. It remains below $67,500 and the 100-hourly Simple Moving Average. On the BTC/USD hourly chart (data feed from Kraken), a significant bearish trend line is taking shape, indicating resistance around $67,200.
While a recovery could be in the cards, bearish pressure may persist around the $67,000 mark.
Bitcoin’s Price Continues to Decline
Bitcoin’s price turned bearish as it breached the $68,000 support zone, leading to a further decline below $65,500 and $65,000 levels. Eventually, it reached the $64,500 territory.
Marking a low near $64,572, the price is now consolidating its losses. An upward movement saw it surpass the $65,000 level and test the 23.6% Fibonacci retracement level of the downward swing from the $71,306 high to the $64,572 low.
Currently, Bitcoin is trading under $67,000 and the 100-hourly Simple Moving Average. On the BTC/USD hourly chart, a significant bearish trend line is forming, indicating resistance around $67,200.
Immediate resistance lies around the $66,000 mark, followed by the primary resistance near $67,200 along with the trend line. A clear breakthrough above the $67,200 resistance might signal a fresh upward momentum. In such a scenario, the price could aim for the 50% Fibonacci retracement level, reaching $67,950.
The upcoming significant resistance hovers around the $68,500 region. Further gains could propel Bitcoin towards the $70,000 resistance zone in the near future.
Further Decline in BTC?
Should Bitcoin fail to surpass the $67,200 resistance zone, a continuation of downward movement may be anticipated. Immediate support on the downside is expected near the $65,200 level.
The primary support level lies at $64,500, followed by another support level at $64,000. A close below $64,000 could initiate a decline towards the $62,500 level. Further losses may lead the price towards the $60,500 support zone in the near term.
Technical Indicators:
Hourly MACD – The MACD indicates a slowdown in bearish momentum.
Hourly RSI (Relative Strength Index) – The RSI for BTC/USD has dipped below the 50 level.
Significant Support Levels – $65,200, followed by $64,500.
Significant Resistance Levels – $66,000, $67,200, and $67,950.