

 indicates a significant signal, while Cardano (ADA) might have formed a double top pattern. The correction for Shiba Inu (SHIB) appears to be underway.")
The beloved meme cryptocurrency in the market, Dogecoin, is sending signals that may hint at its future trajectory. Lately, the asset has exhibited a downward trend in volume, typically interpreted as a cautionary indication of a possible price downturn.
Analyzing the present price chart, we observe DOGE’s local support level hovering around $0.1048, a zone where prices have previously found stability before bouncing back. Conversely, a distinct resistance level lies around $0.1439, which has been tested but not decisively breached in recent trading sessions.
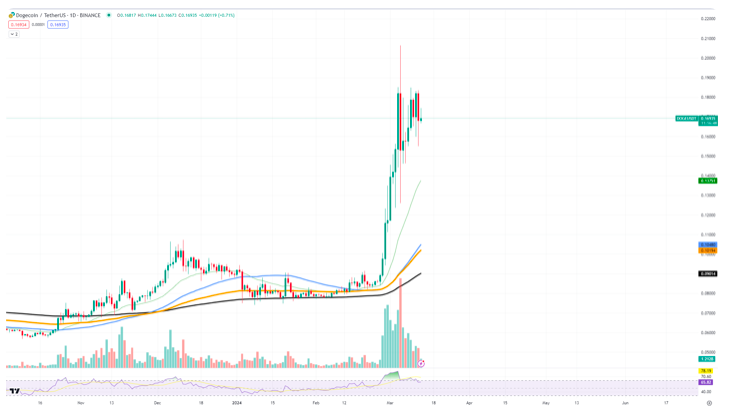
The diminishing volume trend aligns with a price stabilization following a notable surge. This pattern implies that while the enthusiasm for purchasing DOGE at higher levels diminishes, the market lacks the momentum required to maintain upward momentum.
While this doesn’t automatically forecast a decline, other market dynamics could intervene to reignite buyer enthusiasm. Nevertheless, if DOGE breaches the current support level amid sustained low volume, it could confirm a bearish sentiment, potentially leading to further downturns.
Cardano encounters challenges.
Cardano is displaying patterns that are capturing the attention of the trading community. A detailed examination of the charts reveals a formation reminiscent of a double top pattern. This pattern, recognized as a bearish technical reversal signal, emerges when an asset reaches a high price twice consecutively, with a moderate decline between the two peaks.
Identified by two peaks around the same price level, the double top pattern often precedes a decline in value, suggesting that the asset encounters significant resistance at this peak and struggles to surpass it.
In the recent chart analysis of ADA, the token exhibits two distinctive peaks, indicating robust resistance at that level. The initial peak appears to have triggered a sell-off, causing prices to drop, only to rebound to a similar level, forming the second peak.
The current support level for ADA is identified at approximately $0.580, as evidenced by previous consolidations. If the double top pattern materializes, we might witness a price descent towards this support level.
Notably, the resistance level, corresponding to the peaks of the double top, is situated around the $0.738 threshold. A breakout above this level would invalidate the double top scenario, potentially signaling a bullish continuation.
Shiba Inu undergoes a correction phase.
Shiba Inu has garnered significant attention from the market, particularly as the cryptocurrency recently displays indications of a price correction. Despite its notable growth, Shiba Inu now confronts the realities of market dynamics, with a potential reversal looming.
Examining the current price chart, SHIB has encountered resistance around the $0.00003888 level, signaling a slowdown in its upward trajectory. This resistance level holds significance, having been tested multiple times with SHIB struggling to sustain a steady climb beyond this point.
Attention has turned to the support levels amid this development. The initial noteworthy support rests at approximately $0.00003286, crucial in guiding the asset’s trajectory during a potential downtrend. A breach below this level might trigger further selling pressure, potentially leading SHIB to challenge the subsequent support near $0.00002920.
One notable precursor to a correction phase is the mounting selling pressure coupled with a decline in buying momentum. This combination often foreshadows a shift in trader sentiment from bullish to bearish, setting the stage for a downward trend.
Should SHIB fail to uphold its immediate support level, a descent towards the lower support at $0.00002836 might occur, presenting an opportunity for bullish attempts to reclaim dominance in the market.