

 experienced a 40% surge in price within a single day. The question now arises: Is the momentum set to persist?")
The Litecoin landscape has undergone a significant transformation since early February, marked by a notable increase in short-term traders (holding for less than a month) from 7.84 million LTC to an impressive 11.13 million LTC.
Interestingly, there has been a decrease in long-term LTC holding during this period. The recent 40% surge in LTC price prompts a closer analysis of metrics to determine the potential sustainability of this upward trend.
There is a growing presence of Litecoin traders in the market.
Examining the duration of LTC holdings highlights a surge in short-term traders, individuals retaining LTC for less than a month. The quantity of coins held by this group surged from 7.84 million LTC to an impressive 11.13 million LTC, marking a substantial increase of 41.96% within a month.
Nevertheless, this increase in short-term holders has its trade-offs. The count of long-term holders, often referred to as Hodlers (those holding for more than a month), is declining, with their LTC holdings dropping from 45 million to 42.5 million.

The observed trend of an increasing number of short-term traders and a simultaneous decline in long-term holders may impact LTC’s price in two significant ways. Firstly, it could result in heightened volatility as short-term traders typically engage in more frequent buying and selling, contributing to increased price fluctuations.
Secondly, the reduction in Hodlers may signify a loss of confidence among long-term users in LTC, potentially exerting downward pressure on the price.
The Relative Strength Index (RSI) for LTC has recently entered the overbought territory.
Over a 7-day span, LTC’s RSI exhibited a noteworthy shift from 48 to 71, providing insights into its market dynamics and potential future price movements.
The Relative Strength Index (RSI) gauges whether an asset is overbought or oversold by measuring the momentum of price movements, comparing recent gains to losses. Represented as a value between 0 and 100, an RSI above 70 generally indicates an overbought condition, suggesting a potential decline in price. Conversely, an RSI below 30 suggests oversold conditions, signaling a potential upswing in price.
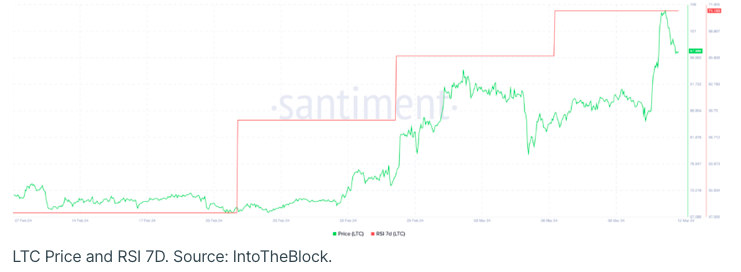
The change in the RSI indicates a substantial surge in buying pressure for Litecoin, highlighting a noteworthy increase in investor interest and market activity. Surpassing the overbought threshold of 70 implies important implications for LTC’s short-term price direction.
This could signify that the asset is entering an overvalued phase, hinting at a potential upcoming price correction. Such situations typically occur as investors start to capitalize on their profits, triggering a sell-off that could potentially temper the upward trajectory of LTC’s price.
LTC Price Forecast: Signals of Significance from EMA Lines
Examining the Litecoin (LTC) price chart ahead of the recent 40% surge presents an intriguing observation. The 200-day Exponential Moving Average (EMA) line was notably positioned below the short-term EMA lines and the prevailing price. This particular technical setup, commonly interpreted as a bullish signal, aligned with a swift LTC price increase from $86 to $105 in a single trading day.
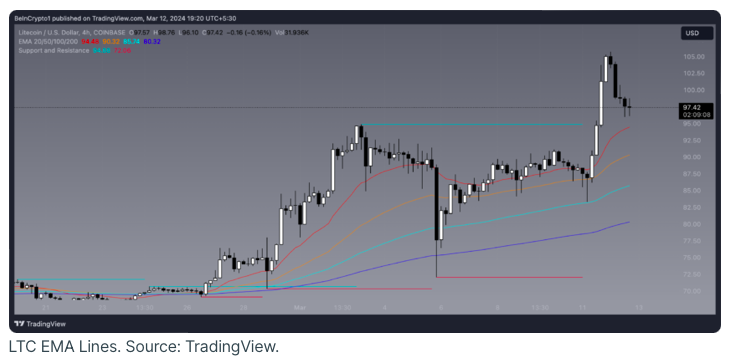
This configuration remains consistent in the more recent timeframe, with the long-term 200-day Exponential Moving Average (EMA) line situated beneath the shorter-term EMA lines and the current price. This well-established technical indicator, historically seen as a bullish signal, implies a potential upcoming uptrend for LTC.
Considering the presence of short-term traders and the EMA lines, there is a possibility of LTC approaching $105 in the near future, although caution is warranted with the RSI above 71. However, if the trend undergoes a reversal and LTC struggles to sustain its momentum, a decline to $72, representing its next robust support zone, could be conceivable.
Should the LTC price fail to find support at the established levels of $93 and $87, a further descent toward $70 might be anticipated. Conversely, a decisive breakthrough above the $100 resistance level could pave the way for a renewed upward movement, potentially reaching $105 again in the short term.