


Bitcoin price is up over 8% and trading above the $67,500 resistance. BTC is eyeing a new all-time high and could even hit the $70,000 level.
- Bitcoin price is moving higher above the $66,500 support zone.
- The price is trading above $67,500 and the 100 hourly Simple moving average.
- There is a connecting bullish trend line forming with support at $66,000 on the hourly chart of the BTC/USD pair (data feed from Kraken).
- The pair could accelerate higher toward the $69,200 resistance or even $70,000.
Bitcoin price experiences another surge.
Bitcoin maintained strong support above the $65,000 mark, establishing a new support base before initiating another upward move beyond the $66,000 level. With a steady climb, it approached the $67,500 mark, marking an impressive 8% increase and nearing the recent all-time high. The peak was reached at $68,786, and currently, the price is consolidating its gains above the 23.6% Fibonacci retracement level from the $61,400 swing low to the $68,786 high.
As of now, Bitcoin is trading above $67,500 and the 100-hourly Simple Moving Average. Additionally, an upward trend is evident, supported by a connecting bullish trend line with a base at $66,000 on the BTC/USD pair’s hourly chart.
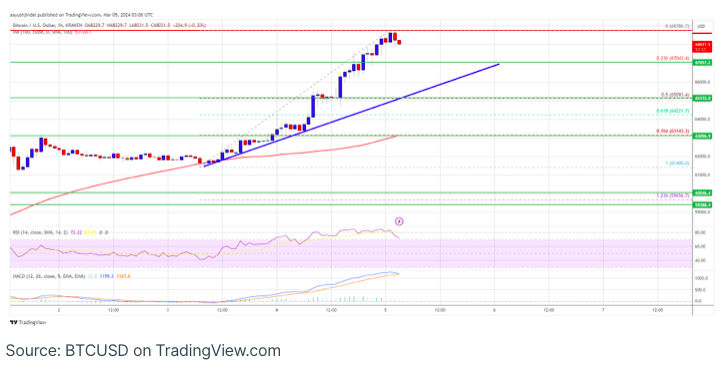
The immediate obstacle lies around the $68,800 level, followed by a significant resistance at $69,200. Surpassing this hurdle may propel the price towards the $70,000 resistance zone. A decisive breakthrough above $70,000 could pave the way for further upward movement, targeting the $71,200 level. Extended gains might even propel the price toward the $75,000 mark.
Is BTC Poised for a Downside Correction?
Correction. Immediate downside support is observed near the $67,000 level.
The primary support comes in at $66,000 or the existing trend line. A close below $66,000 might initiate a substantial retracement, targeting the 50% Fibonacci retracement level of the upward movement from the $61,400 swing low to the $68,786 high, or approximately $65,000. Further downward momentum could lead the price toward the support zone at $63,200.
Technical indicators:
- Hourly MACD – The MACD is currently gaining momentum in the bullish zone.
- Hourly RSI (Relative Strength Index) – The RSI for BTC/USD is presently above the 50 level.
Key Support Levels – $67,000, followed by $66,000.
Key Resistance Levels – $68,800, $69,200, and $70,000.