


Ethereum price climbed to a new multi-month high above $3,400. ETH is consolidating like Bitcoin and seems to be setting up for another bullish spree.
- Ethereum extended its increase above the $3,400 resistance zone.
- The price is trading above $3,350 and the 100-hourly Simple Moving Average.
- There is a key bullish trend line forming with support at $3,250 on the hourly chart of ETH/USD (data feed via Kraken).
- The pair could correct lower, but dips might be limited below the $3,250 support zone.
Ethereum’s Price Continues its Rally
The Ethereum price sustained its bullish momentum, establishing stability above the $3,000 pivot level. Concurrently, Bitcoin showcased robust upward movements beyond the $60,000 resistance, surging towards $64,000. Ethereum initiated a noteworthy ascent, surpassing the $3,320 resistance.
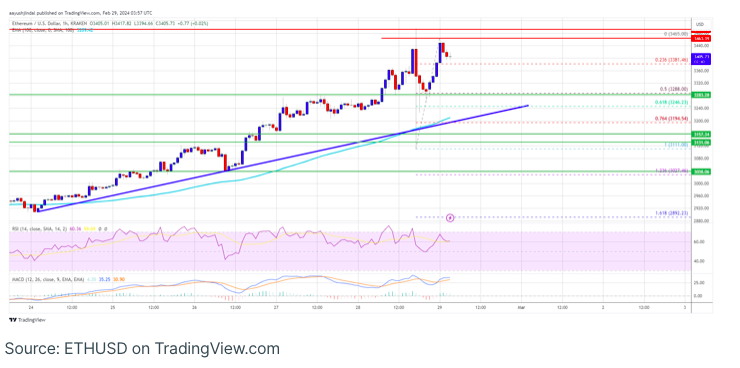
Experiencing a surge of over 10%, it even reached the $3,500 level, marking a new multi-month high at $3,496. However, a sharp decline followed, leading to a low at $3,111. Currently, the price is striving for a renewed upswing, holding above the 23.6% Fibonacci retracement level from the $3,111 swing low to the $3,465 high.
Ethereum is presently trading above $3,350 and the 100-hourly Simple Moving Average. On the hourly chart of ETH/USD, a crucial bullish trend line is forming, with support at $3,250. This trend line aligns closely with the 61.8% Fibonacci retracement level of the upward wave from the $3,111 swing low to the $3,465 high.
The immediate upside resistance lies near the $3,450 level, followed by the primary hurdle at $3,500. Beyond this, the subsequent significant resistance is positioned at $3,550, a breakthrough of which could trigger further bullish momentum.
A breakthrough above the $3,550 resistance could propel Ether towards the $3,680 resistance. Further upward momentum might prompt a test of $3,800.
Is Ethereum Poised for a Downward Correction?
If Ethereum is unable to surpass the $3,450 resistance, it might initiate a downside correction. Initial support on the downside is anticipated around the $3,380 level.
The first significant support zone is situated near $3,285. Following that, the key support areas could be the $3,250 zone and the associated trend line. A decisive move below the $3,250 support level could lead to a decline in price towards $3,120. Further losses might extend the descent towards the $3,050 level.
As for technical indicators, the hourly MACD for ETH/USD is gaining momentum in the bullish zone, and the hourly RSI is currently above the 50 level.
Key Support Level: $3,285
Key Resistance Level: $3,450