

 Achieves its Highest Weekly Closure in a Year – What Awaits in the Future?")
Last week, Ethereum (ETH) attained its highest weekly closure since April 2022, subsequently surpassing the $3,000 mark this week.
Will this surge propel Ethereum to a new all-time high, or will the price struggle to maintain its momentum? Let’s delve into the analysis to find out!
Ethereum Breaks Through Long-Term Resistance
The technical analysis on the weekly time frame indicates a substantial surge in the ETH price over the past two weeks, forming a notable bullish weekly candlestick. This trend was particularly pronounced in the previous week.
Ethereum’s upward momentum resulted in the first weekly close above a longstanding horizontal zone, which has alternately functioned as both resistance and support since April 2021. Today, ETH reached a peak of $3,032, marking its highest point since April 2022.
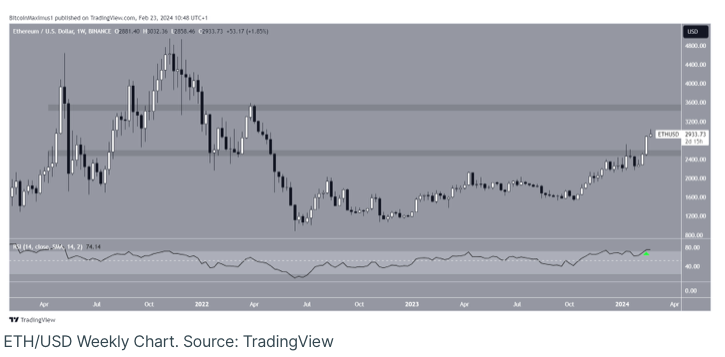
ETH/USD Weekly Chart. Source: TradingView
The weekly Relative Strength Index (RSI) corroborates the continuous upward momentum. Traders employ the RSI as a momentum gauge to evaluate whether a market is excessively bought or oversold, guiding decisions on asset accumulation or selling.
An RSI reading above 50, coupled with an upward trend, signifies continued bullish dominance. Conversely, a reading below 50 indicates the opposite. With the indicator surpassing 70, it signifies an intensification of the bullish trend.
What Insights Do Analysts Offer?
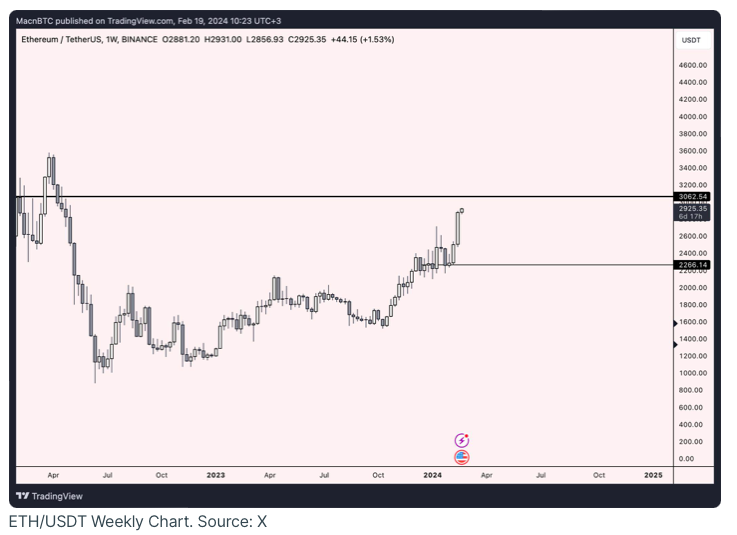
Traders and analysts on platform X express optimistic sentiments about the prospective trend of Ethereum. MacnBTC observed a notable absence of resistance beyond the $3,050 level.
CryptoMichNL suggests an ongoing shift towards the Ethereum ecosystem. Eliz883 emphasizes the significance of the $3,100 level, anticipating a substantial upward movement upon a breakout. InmortalCrypto predicts that ETH will surpass SOL in performance in the near future.
What Comes Next After Ethereum (ETH) Reaches $3,000?
The weekly wave count indicates the likelihood of a sustained uptrend. Employing the Elliott Wave theory, technical analysts scrutinize enduring price patterns and recurrent investor psychology to ascertain the trajectory of a trend.
The prevailing wave count suggests that Ethereum’s (ETH) price is currently in the third wave of a five-wave upward movement. The sub-wave count, depicted in black, implies that the price is navigating the concluding sub-wave.
The breakout from the ascending parallel channel lends support to the validity of this wave count.
Should the breakout persist, there is potential for ETH to experience a further 16% increase, reaching the 0.618 Fib retracement resistance level at $3,400.
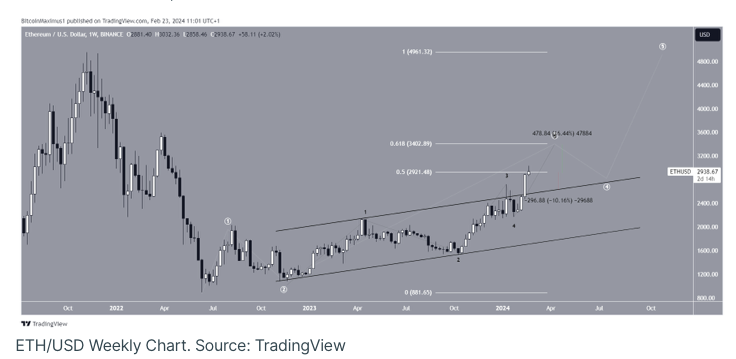
In contrast to the optimistic Ethereum (ETH) price forecast, a failure to secure a closure above the 0.5 Fib retracement resistance level at $2,920 could instigate a 10% decline towards the channel’s support at $2,630.
For the most recent cryptocurrency market analysis from BeInCrypto, click here.