


Bitcoin price is correcting gains from the $52,500 resistance. BTC must stay above the $50,500 support to remain in a bullish zone this month.
- Bitcoin price is struggling to clear the $52,800 resistance zone.
- The price is trading below $52,200 and the 100 hourly Simple moving average.
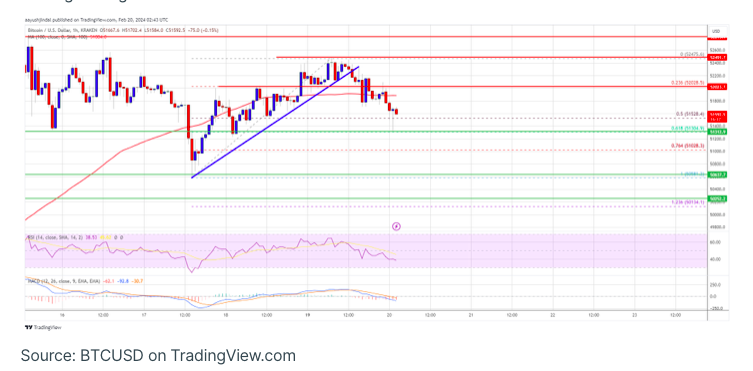
- There was a break below a key bullish trend line with support at $52,200 on the hourly chart of the BTC/USD pair (data feed from Kraken).
- The pair could start a fresh increase unless there is a clear move below the $50,500 support.
Bitcoin Price Encounters Obstacles
Bitcoin attempted once more to strengthen above the $52,000 resistance zone. Although BTC successfully surpassed the $52,200 level, bearish activity persisted near the $52,500 level.
The price reached a peak around $52,475 before undergoing a correction. Subsequently, it dipped below the $52,000 level and traded beneath the 50% Fibonacci retracement level of the upward movement from the $50,581 swing low to the $52,475 high.
Additionally, a crucial bullish trend line with support at $52,200 on the BTC/USD hourly chart was breached. Bitcoin is currently trading below $52,000 and the 100-hourly Simple Moving Average.
The initial obstacle lies at the $52,000 level, followed by a significant resistance at $52,200. If breached, the price may ascend towards the $52,500 resistance zone. The primary hurdle remains around the $52,800 level. A decisive breakthrough above this resistance could propel the price towards the $53,500 resistance, with the subsequent obstacle anticipated near the $55,000 level.
Is Bitcoin Set for Further Declines?
Should Bitcoin prove unable to surpass the $52,200 resistance zone, a potential downturn may unfold in the near term. Immediate support on the downside is expected around the $51,300 level, coupled with the 61.8% Fibonacci retracement level from the upward movement between the $50,581 swing low to the $52,475 high.
The primary support level is identified at $51,000. A close below this mark could trigger bearish momentum, potentially leading the price towards the $50,500 support zone. A breach below this level might signify a bearish trend in the short term.
Analyzing the technical indicators:
- The hourly MACD for BTC/USD is currently gaining momentum in the bearish zone.
- The hourly RSI for BTC/USD is positioned below the 50 level.
Key Support Levels:
- $51,300, followed by $50,500.
Key Resistance Levels:
- $52,200, $52,500, and $52,800.