


Bitcoin maintains its upward momentum above the $52,000 resistance level, consolidating gains and potentially targeting further increases towards the $55,000 resistance.
Positive indications are evident as Bitcoin exhibits strength below the $52,800 resistance zone. The price is currently trading above $51,500 and the 100-hourly Simple Moving Average. On the hourly chart of the BTC/USD pair from Kraken, a bullish trend line is forming, connecting with support at $51,500.
The potential for continued upward movement remains if the pair successfully surpasses the $52,800 resistance zone.
Bitcoin’s price is set on pursuing additional gains.
Bitcoin’s price surged beyond the $51,200 resistance area, successfully breaking the $52,000 resistance zone to establish a new multi-week high around $52,843. Currently, the cryptocurrency is in a phase of consolidating these gains.
Although there was a slight downturn below the $52,000 level, the price retraced below the 23.6% Fibonacci retracement level of the upward movement from the $48,240 swing low to the $52,843 high. Nevertheless, the bulls demonstrated strength, preventing further decline and maintaining activity above the crucial $51,200 support zone.
As of now, Bitcoin is trading above $51,500 and the 100-hourly Simple Moving Average. On the hourly chart of the BTC/USD pair, a bullish trend line is taking shape with support at $51,500, indicating a positive trend in the near term.
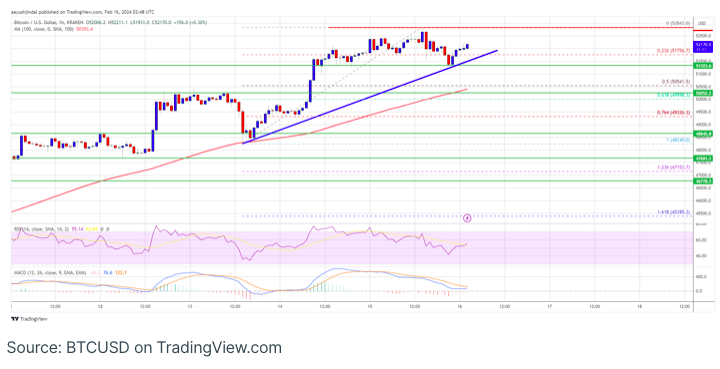
The initial hurdle lies in the vicinity of the $52,500 level, serving as immediate resistance. Subsequently, a pivotal resistance point is anticipated at $52,800, and surpassing this could potentially propel the price further in its upward trend. The bulls may then set their sights on the $53,200 mark, and a decisive breakthrough could pave the way for a move towards the $54,000 resistance. Further ahead, the next notable resistance level may emerge around $55,000.
Are Dips Supported In BTC?
correction in the near term. Immediate support on the downside is near the $51,500 level and the trend line.
The first major support is $50,550 and the 50% Fib retracement level of the upward move from the $48,240 swing low to the $52,843 high. If there is a close below $50,500, the price could gain bearish momentum. In the stated case, the price could dive toward the $48,500 support zone.
Technical indicators:
Hourly MACD – The MACD is now gaining pace in the bullish zone.
Hourly RSI (Relative Strength Index) – The RSI for BTC/USD is now above the 50 level.
Major Support Levels – $51,500, followed by $50,500.
Major Resistance Levels – $52,500, $52,800, and $54,000.