


Ethereum’s price is in a consolidation phase, maintaining gains above the $2,575 support level. The potential for a significant rally exists if the price successfully closes above the $2,700 resistance. Currently, Ethereum is trading above $2,620 and the 100-hourly Simple Moving Average. On the hourly chart of ETH/USD, a short-term breakout pattern is emerging, with resistance at $2,640. The pair may initiate a new uptrend if it sustains its position above the $2,575 support zone.
Ethereum’s price is poised for another upward movement.
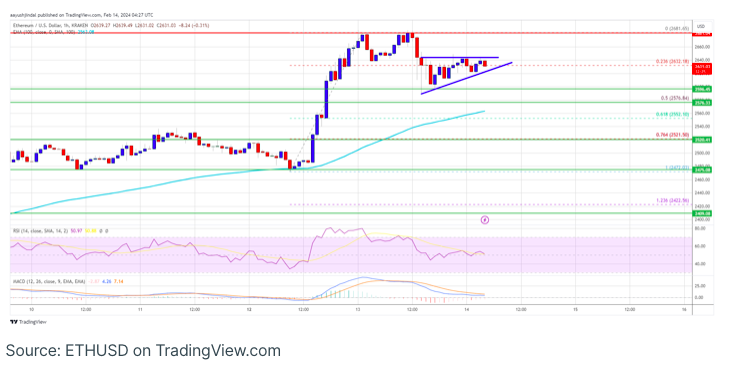
Ethereum’s price gained momentum, surpassing the $2,600 threshold and approaching the $2,700 resistance zone. Reaching as high as $2,681, it later underwent a corrective downturn.
This correction led to a dip below the $2,640 and $2,620 levels, breaking the 23.6% Fibonacci retracement level of the upward movement from the $2,472 swing low to the $2,681 high, mirroring Bitcoin’s trend. However, bullish activity emerged around the $2,600 region.
Ethereum found support at $2,600 and is currently making efforts for a renewed uptrend. It is presently trading above $2,620 and the 100-hourly Simple Moving Average.
The immediate obstacle is near the $2,640 level, with a short-term breakout pattern forming on the hourly chart of ETH/USD, indicating resistance at $2,640. The primary resistance lies at the $2,680 level, followed by a major hurdle at $2,720. A successful breach of these levels could propel the price toward testing the $2,800 resistance.
Should the bullish momentum persist, there is potential for the price to surpass the $2,800 resistance. In such a scenario, the price may ascend towards the $3,000 level.
Another Decline In ETH?
If Ethereum encounters difficulty in surpassing the $2,640 resistance, it may initiate a downward trend. Initial support on the downside is anticipated near the $2,620 level.
The subsequent critical support zone could be around $2,600. A decisive move below the $2,600 support might lead the price towards $2,575 or the 50% Fibonacci retracement level of the upward movement from the $2,472 swing low to the $2,681 high. The primary support level remains at $2,550 or the 100-hourly Simple Moving Average (SMA). Further losses could potentially drive the price towards the $2,440 level.
In terms of technical indicators, the hourly Moving Average Convergence Divergence (MACD) for ETH/USD is showing increased bullish momentum. Additionally, the hourly Relative Strength Index (RSI) for ETH/USD is currently above the 50 level.
Key Levels:
- Major Support Level: $2,600
- Major Resistance Level: $2,640