


The price of Ethereum is currently consolidating its gains, holding steady above the $2,400 mark. A potential significant uptrend might unfold if there is a clear breakthrough above the resistance level at $2,460.
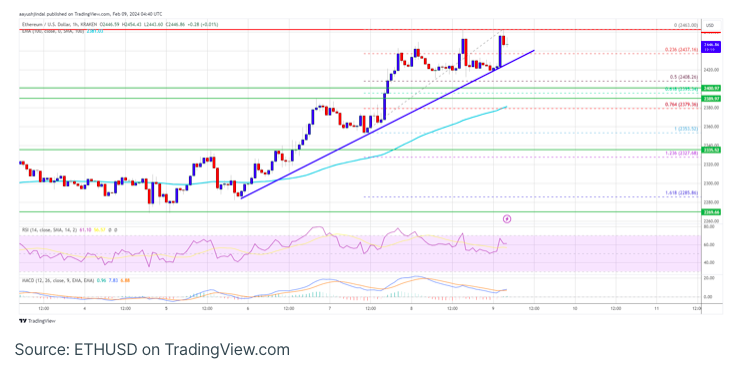
As Ethereum consolidates, it is maintaining its position below the resistance zone of $2,460. The current trading scenario sees the price above $2,400 and the 100-hourly Simple Moving Average. On the hourly chart of ETH/USD provided by Kraken, a notable bullish trend line is taking shape, indicating support at $2,435.
For a potential upward movement, it is crucial for Ethereum to surpass the resistance levels at $2,460 and $2,480, suggesting the possibility of a fresh increase in the pair.
Ethereum is poised for an upward trajectory in its price.
After breaking the $2,350 resistance, Ethereum’s price exhibited a consistent uptrend, surpassing $2,400 and testing the $2,460 zone. The peak reached approximately $2,463, and currently, the price is consolidating gains. Meanwhile, Bitcoin extended its surge beyond the $45,000 threshold.
Ether maintains its position above the 23.6% Fibonacci retracement level of the recent movement, stretching from the $2,352 low to the $2,463 high. Additionally, an important bullish trend line is taking shape, providing support at $2,435 as depicted on the hourly chart of ETH/USD.
Trading above both $2,400 and the 100-hourly Simple Moving Average, Ethereum could experience a renewed upswing, potentially surpassing the $2,460 level. The initial significant resistance lies near $2,500, followed by a subsequent hurdle at $2,550. A breakthrough beyond these levels might propel the price to test the $2,620 resistance.
Should the bullish momentum persist, there is potential for the price to surpass the $2,620 resistance. Under such circumstances, the price may ascend towards the $2,700 level.
Is Ethereum Poised for Another Bearish Wave?
If Ethereum is unable to surpass the $2,460 resistance, a potential downward correction might ensue. Initial support on the downside is anticipated near the $2,435 level and the established trend line.
The subsequent crucial support could be around the $2,400 zone or the 50% Fibonacci retracement level, derived from the recent wave spanning from the $2,352 swing low to the $2,463 high. Should the price convincingly dip below the $2,400 support, it could lead to a descent towards $2,375. The primary support level lies at $2,350, and further losses may drive the price towards the $2,240 level.
Examining the technical indicators, the hourly MACD for ETH/USD indicates a waning bullish momentum, while the hourly RSI is currently above the 50 level.
Key levels to watch include a major support level at $2,400 and a significant resistance level at $2,460.