


Bitcoin is showing momentum above the $44,000 resistance, with the potential for further gains if it manages to surpass the $44,800 resistance zone in the short term.
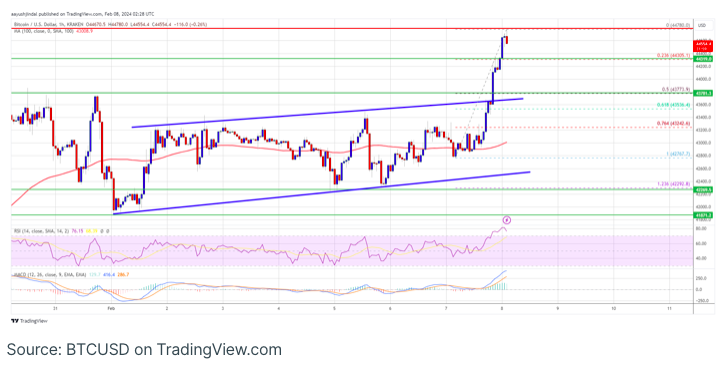
The price of Bitcoin successfully exceeded the resistance levels at $43,400 and $43,500. Currently, it is trading above $44,000 and the 100-hourly Simple Moving Average. Notably, the hourly chart of the BTC/USD pair (data feed from Kraken) indicates a significant breakthrough of a major rising channel with resistance at $43,650.
If Bitcoin can overcome the $44,800 resistance zone, there is a possibility for the pair to sustain its upward movement.
The price of Bitcoin initiates a new uptrend.
Bitcoin’s price exhibited strong support above the $42,500 level and initiated a fresh upward movement by surpassing the $43,400 and $43,500 resistance levels. Additionally, there was a notable breakthrough above a significant rising channel with resistance at $43,650 on the hourly chart of the BTC/USD pair.
The pair experienced a surge beyond the $44,000 resistance zone, reaching a new weekly high at $44,780, and is presently consolidating its gains. Trading above the 23.6% Fibonacci retracement level of the upward move from the $42,767 swing low to the $44,780 high, Bitcoin is currently positioned above $44,000 and the 100-hourly Simple Moving Average.
Immediate resistance is anticipated near the $44,800 level, with the next key resistance potentially at $45,000. If successfully breached, this could pave the way for another significant increase, with a potential target for the bulls at $45,750.
If the price convincingly surpasses the $45,750 resistance, it may propel towards the $46,500 resistance. Subsequently, the following resistance is likely around the $47,200 level. A decisive close above the $47,200 level has the potential to drive the price even higher, with the next significant resistance standing at $48,500.
Is there a potential for a downward correction in BTC?
If Bitcoin is unable to surpass the $44,800 resistance zone, there is a possibility of initiating a downside correction. Immediate support on the downside can be found near the $44,300 level.
The primary support levels include $43,750 and the 50% Fibonacci retracement level of the upward move from the $42,767 swing low to the $44,780 high. A close below $43,750 could potentially lead to bearish momentum, with the price potentially descending towards the $43,000 support.
Examining the technical indicators, the hourly MACD is gaining momentum in the bullish zone, while the hourly RSI (Relative Strength Index) for BTC/USD is currently above the 50 level.
Key support levels to monitor are $44,300, followed by $43,750, while major resistance levels include $44,800, $45,750, and $45,500.