


Ethereum’s price is currently striving for an upward correction after finding support around $2,150. For the potential acceleration of this correction, surpassing the $2,240 resistance area is crucial.
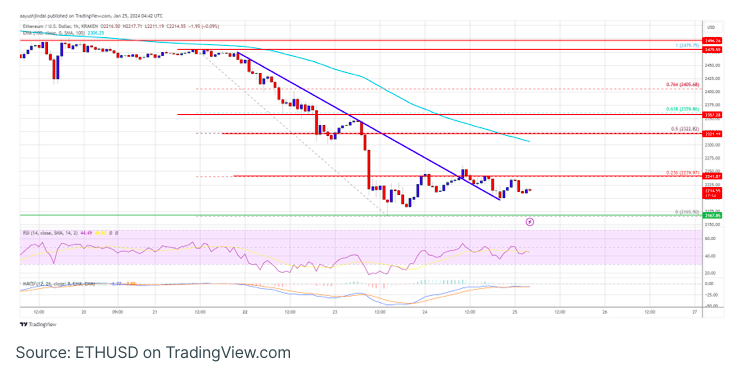
Commencing an upward correction from the $2,165 level, Ethereum is currently trading beneath both $2,240 and the 100-hourly Simple Moving Average. Notably, on the hourly chart of ETH/USD sourced from Kraken, a bearish trend line resistance near $2,235 was breached.
Should the cryptocurrency successfully surpass the $2,240 resistance zone, it may initiate a stable ascent.
Support for Ethereum’s price remains intact.
Ethereum’s value experienced a further dip below the critical $2,240 support zone. Initially dropping below $2,200, the cryptocurrency found support around $2,165, establishing a brief foundation before initiating an upward correction, mirroring Bitcoin’s movement.
The rally saw Ethereum surpass the $2,200 resistance level and break a bearish trend line, marked with resistance at $2,235 on the hourly ETH/USD chart. However, resistance from bears materialized near the $2,240 mark, successfully defending the 23.6% Fibonacci retracement level calculated from the downward movement spanning the $2,480 peak to the $2,165 low.
Presently, Ethereum is trading beneath both $2,240 and the 100-hourly Simple Moving Average. Resistance persists around the $2,240 level. The next obstacles include the $2,300 level or the 100-hourly Simple Moving Average. A successful breach may lead to testing the 50% Fib retracement level at $2,320, with the subsequent major resistance standing at $2,360.
A decisive breakthrough above the $2,360 threshold could initiate a substantial uptrend. Under such circumstances, the price has the potential to ascend towards the $2,420 mark. Further positive momentum may propel the price towards the $2,500 zone.
Another Drop in ETH?
If Ethereum encounters difficulty in surpassing the $2,240 resistance, it could trigger a renewed downturn. Initial downside support is anticipated around the $2,200 level.
The subsequent critical support lies in the $2,165 zone. A break below this level may initiate a significant decline, potentially leading Ether to test the $2,080 support. Further losses could drive the price towards the $2,000 level.
Analyzing technical indicators, the hourly MACD for ETH/USD indicates a waning bearish momentum, while the hourly RSI has dipped below the 50 level.
Key Levels:
- Major Support Level: $2,165
- Major Resistance Level: $2,240