


Bitcoin’s price initiated an upward correction from the support area around $38,500, aiming to gather bullish momentum upon breaching the $40,500 resistance zone.
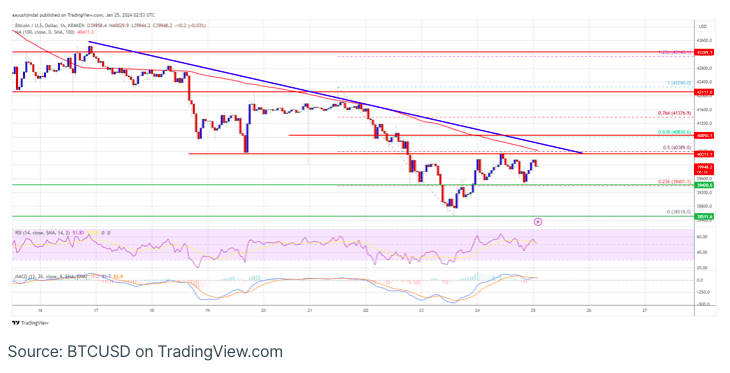
In the process of a recovery wave from the $38,500 support, the price is currently situated below both $40,000 and the 100-hourly Simple Moving Average. The hourly chart of the BTC/USD pair from Kraken reveals the formation of a significant bearish trend line, presenting resistance in the vicinity of $40,400.
Challenges may arise in the attempt to surpass the $40,400 and $40,500 resistance levels, potentially impacting the recovery prospects for the pair.
Bitcoin’s price is making an effort to recover from recent declines.
Bitcoin’s price witnessed a continuation of its decline, slipping below the $40,000 support zone. The decline led to a dip below $39,200, with the price testing the $38,500 support zone and establishing a new weekly low around $38,518. Subsequently, an upward correction unfolded.
A recovery wave lifted the price above the $39,200 and $39,500 levels. Despite these gains, Bitcoin is currently trading below both $40,000 and the 100-hourly Simple Moving Average.
Immediate resistance is evident near the $40,400 level, marked by a significant bearish trend line on the BTC/USD hourly chart. This trend line aligns with the 50% Fibonacci retracement level of the downward wave, extending from the $42,260 swing high to the $38,518 low.
Further hurdles may emerge at the $40,500 level, beyond which a potential rise could lead to a test of $40,850. This level corresponds closely to the 61.8% Fibonacci retracement level of the downward wave from the $42,260 swing high to the $38,518 low.
A decisive breakthrough above the $40,850 resistance has the potential to propel the price towards the $41,500 resistance. Subsequently, a new resistance is emerging around the $42,000 level. Surpassing the $42,000 level in a close could contribute to further upward momentum. The subsequent significant resistance lies at $42,500.
Is Bitcoin Headed for Another Decline?
Should Bitcoin fall short of surpassing the $40,400 resistance zone, it might trigger a renewed downtrend. Immediate downside support is anticipated around the $39,400 level.
The subsequent significant support level is at $38,500. A close below this threshold could instigate bearish momentum, potentially leading the price to test the $37,000 support in the short term.
Examining the technical indicators, the hourly MACD for BTC/USD is indicating a diminishing pace in the bearish zone. Conversely, the hourly RSI (Relative Strength Index) has risen above the 50 level.
Key Levels:
- Major Support Levels: $39,400, followed by $38,500
- Major Resistance Levels: $40,400, $40,500, and $40,850.