


Efforts by Ethereum to surpass the $2,550 and $2,580 levels proved unsuccessful, leading to a renewed decline in tandem with Bitcoin. The cryptocurrency dipped below the crucial $2,500 support zone.
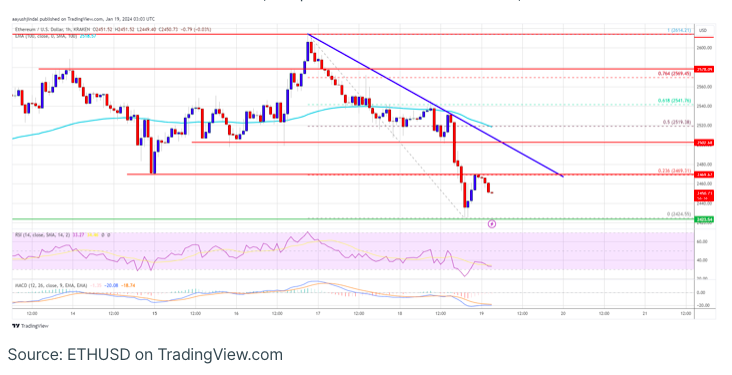
Despite an attempt at a fresh increase, Ethereum struggled to break the $2,550 barrier. Currently, the price is trading beneath both $2,500 and the 100-hourly Simple Moving Average. The hourly chart of ETH/USD, based on Kraken data feed, reveals the formation of a bearish trend line with resistance around $2,480.
The potential for further downside remains, particularly if the price drops below the critical $2,425 support level.
The decline in Ethereum’s price continues to persist.
Ethereum encountered challenges in gaining momentum to surpass resistance at $2,550 and $2,580. Similar to Bitcoin, ETH established a short-term peak and initiated a fresh downturn, falling below the $2,500 mark.
The price experienced a dip below the $2,450 level, reaching a new weekly low at approximately $2,424, and is presently consolidating losses. Although there was a marginal uptick above $2,450, the bears were active near the 23.6% Fibonacci retracement level of the downward movement from the $2,614 peak to the $2,424 low.
Currently, Ethereum is trading beneath both $2,500 and the 100-hourly Simple Moving Average. Resistance looms around the $2,465 level, with an additional obstacle at $2,480, marked by a connecting bearish trend line on the hourly ETH/USD chart.
The subsequent significant resistance is situated near $2,520. A clear breakthrough above this level could potentially initiate a noteworthy upward movement. In such a scenario, the price might target the $2,580 level.
The upcoming critical barrier is positioned in the vicinity of the $2,620 zone. A decisive breakthrough above the $2,620 resistance has the potential to trigger a sustained upward trend. The subsequent pivotal resistance is around $2,680, and further advances could propel the price towards the $2,720 region.
Could Ethereum Experience Further Declines?
Should Ethereum be unable to surpass the $2,520 resistance, a potential downturn could ensue. Initial downside support is anticipated around the $2,440 level.
The subsequent crucial support lies in the $2,425 zone. A breach below this level might lead to a further decline, possibly testing the $2,350 support. If losses persist, there’s a likelihood of the price descending toward the $2,320 level.
Examining the technical indicators, the hourly MACD for ETH/USD indicates a growing bearish momentum, while the hourly RSI has dipped below the 50 level.
Key Levels:
- Major Support Level: $2,425
- Major Resistance Level: $2,520