


Bitcoin’s value continued its descent, breaching the crucial $41,450 support zone. The cryptocurrency is displaying bearish indicators, raising concerns about its ability to remain above the $40,000 support zone.
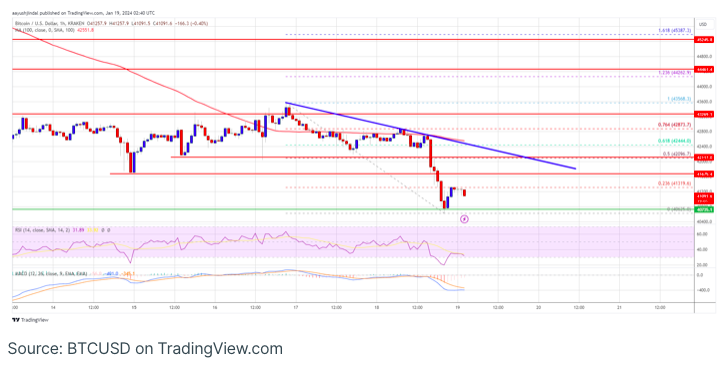
Bitcoin is witnessing an increase in bearish momentum, trading below the $42,500 threshold. The price is currently positioned beneath both $42,000 and the 100-hourly Simple Moving Average. On the hourly chart of the BTC/USD pair based on Kraken data feed, a significant bearish trend line is emerging, presenting resistance around $42,100.
This development puts the pair at risk of further declines, potentially heading towards the $40,000 support zone.
Bearish Momentum Strengthens for Bitcoin’s Price
Bitcoin’s attempt to initiate a recovery above the $43,250 resistance zone proved unsuccessful, leading to the formation of a short-term peak and a subsequent decline below the $42,120 support zone.
The bears successfully pushed the price beneath the critical $41,450 level, resulting in a new weekly low around $40,625. The current scenario involves the consolidation of losses, with the price hovering near the 23.6% Fibonacci retracement level of the recent downturn from the $43,569 peak to the $40,625 low.
As of now, Bitcoin is trading below both $42,000 and the 100-hourly Simple Moving Average. Additionally, an essential bearish trend line is taking shape, presenting resistance around $42,100 on the BTC/USD hourly chart.
On the upside, resistance is encountered near the $41,675 level, with the subsequent key barrier located around the $42,100 zone, closely aligned with the trend line. This level is also proximate to the 50% Fibonacci retracement level of the recent decline from the $43,569 peak to the $40,625 low.
A decisive breakthrough above the $42,100 resistance has the potential to propel the price towards the $43,250 resistance. Subsequently, a new resistance is emerging around the $43,500 level. If there is a confirmed close above $43,500, it may lead to further upward movement. The subsequent significant resistance level is positioned at $44,450.
More Losses In BTC?
If Bitcoin fails to rise above the $42,100 resistance zone, it could continue to move down. Immediate support on the downside is near the $40,750 level.
The next major support is $40,500. If there is a close below $40,500, the price could gain bearish momentum. In the stated case, the price could drop toward the $40,000 support in the near term.
Technical indicators:
Hourly MACD – The MACD is now gaining pace in the bearish zone.
Hourly RSI (Relative Strength Index) – The RSI for BTC/USD is now below the 50 level.
Major Support Levels – $40,750, followed by $40,000.
Major Resistance Levels – $41,675, $42,100, and $43,250.