


The Ethereum price underwent a correction, testing the $2,440 support level. Currently, ETH is consolidating within a range and encountering obstacles around the $2,550 and $2,585 thresholds.
Ethereum is making an effort to initiate a fresh upward movement starting from the $2,450 level.
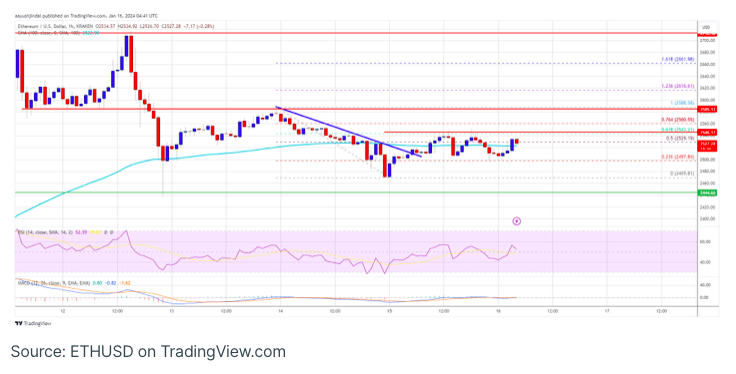
The current trading position is slightly above $2,500, with the 100-hourly Simple Moving Average providing support.
On the hourly chart of ETH/USD (data feed via Kraken), there was a breakthrough of a connecting bearish trend line with resistance around $2,510.
If the pair successfully surpasses the resistance levels at $2,550 and $2,585, it could gain positive momentum.
Ethereum Maintains Crucial Support Level.
The Ethereum price initiated a downward correction, slipping below the $2,620 support region. ETH extended its decline beneath the $2,550 mark, but found support around $2,440 where bullish activity emerged. A low was established near $2,469, and presently, the price is consolidating within a range, mirroring Bitcoin’s behavior.
There was a minor uptick above the $2,500 level, with the price surpassing the 50% Fibonacci retracement level of the recent downturn from the $2,588 swing high to the $2,469 low.
Additionally, a bearish trend line was breached with resistance at approximately $2,510 on the hourly chart of ETH/USD. Ethereum is currently trading just above $2,500 and is supported by the 100-hourly Simple Moving Average. On the upside, resistance is encountered near the $2,540 level, corresponding to the 61.8% Fibonacci retracement level of the recent drop from the $2,588 swing high to the $2,469 low.
The upcoming significant hurdle lies around $2,585. A decisive breakthrough above this level has the potential to initiate a substantial uptrend. In such a scenario, the price may advance towards the $2,650 mark. The primary resistance is currently taking shape in the vicinity of $2,720. A successful breach of the $2,720 barrier could trigger another noteworthy surge. The subsequent crucial resistance is situated around $2,780. Further upward movements could propel the price towards the $2,880 zone.
Could Ethereum Experience Another Decline?
If Ethereum is unable to surpass the $2,585 resistance, there is potential for another downward movement. Initial support on the downside is expected around the $2,495 level.
The subsequent crucial support could be the $2,445 zone. A breach below the $2,445 support might trigger a further decline, with Ether potentially testing the $2,380 support. Additional losses could push the price towards the $2,320 level.
Technical Indicators:
Hourly MACD – The MACD for ETH/USD is indicating a decrease in bullish momentum.
Hourly RSI – The RSI for ETH/USD is currently slightly above the 50 level.
Major Support Level – $2,445
Major Resistance Level – $2,585