


Bitcoin’s price reached its highest point close to the $49,000 resistance area before experiencing a significant downturn. This resulted in the breach of several crucial support levels, notably the $45,000 mark, placing it in a short-term bearish trend.
Currently, Bitcoin is in a steady decline and is trading below $43,500 and the 100-hourly Simple Moving Average. The hourly chart for the BTC/USD pair from Kraken indicates the formation of a connecting bearish trend line, with resistance around $42,850.
The pair may undergo a fresh decline if it breaks below the $41,500 support zone.
Bitcoin’s price experiences a significant decline.
Bitcoin failed to test the $50,000 resistance zone, reaching its peak around $49,000 before initiating a substantial decline. The decline saw a strong break below crucial support levels at $48,000 and $46,500.
The bears exerted further pressure, pushing the price beneath the $45,000 support zone, resulting in a more than 12% decline, testing the $41,500 support zone. The cryptocurrency found a low around $41,476 before initiating a recovery. Although there was a minor increase above the $42,000 resistance zone, Bitcoin continues to trade below $43,500 and the 100-hourly Simple Moving Average.
Looking ahead, immediate resistance is observed around the $42,800 level, accompanied by a connecting bearish trend line with resistance near $42,850 on the BTC/USD pair’s hourly chart. The primary obstacle lies at $43,250, representing the 23.6% Fibonacci retracement level of the downward move from the $49,000 swing high to the $41,476 low.
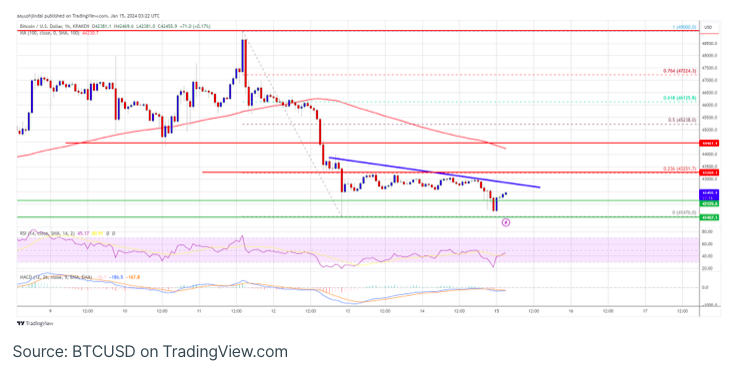
If there is a decisive break above the $43,250 resistance, the price may advance towards the $44,000 resistance. The subsequent resistance is taking shape around the $45,200 level, closely aligned with the 50% Fibonacci retracement level of the downward movement from the $49,000 swing high to the $41,476 low. An effective close above the $45,300 level has the potential to trigger a robust upward movement, leading to an ascent in price. The subsequent significant hurdle lies at $47,000.
Could Bitcoin Experience Further Declines?
If Bitcoin is unable to surpass the resistance at $43,250, it may initiate a new downward trend. Immediate support on the downside is evident around the $42,120 level.
The subsequent crucial support lies at $41,500. A breach below this level could trigger bearish momentum, potentially causing the price to descend towards the $40,000 support in the short term.
Technical indicators:
Hourly MACD – The MACD is currently decelerating within the bearish zone.
Hourly RSI (Relative Strength Index) – The RSI for BTC/USD has dipped below the 50 level.
Key Support Levels – $42,120, followed by $41,500.
Key Resistance Levels – $42,800, $43,250, and $44,000.