


Bitcoin (BTC) experiences a downturn, with the ticker showing $42,977, reflecting a decrease of approximately $4,000 following the approval of Bitcoin spot exchange-traded funds (ETF) in the U.S. This suggests an emerging “sell-the-news” sentiment in the market. Concurrently, technical chart patterns suggest the potential for an ongoing sell-off in the upcoming days or weeks. What unfolds next, and what is the potential bottom for the Bitcoin price?
The target for Bitcoin’s maximum pain is set at $34,850.
Observed in the daily chart provided, Bitcoin’s price path reveals a period of consolidation confined within a bullish channel.
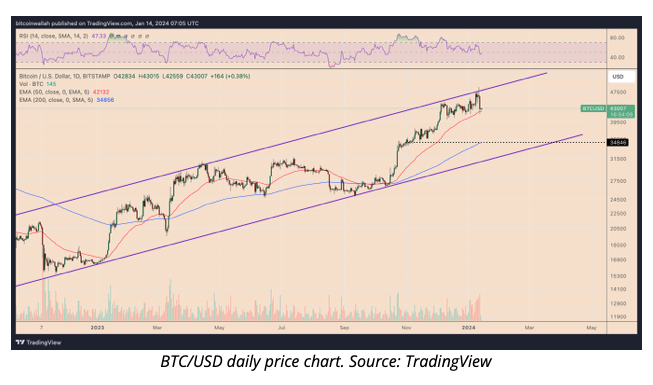
As of January 14, the 50-day exponential moving average (50-day EMA, represented by the red wave) has been a supportive factor around $42,120, with prices maintaining levels above it. However, the relative strength index (RSI) is currently hovering near the mid-line, suggesting a lack of robust bullish momentum.
Moreover, the RSI has recently formed lower highs while Bitcoin has been forming higher highs, indicating an emerging bearish divergence.
Considering this, a breach below the 50-day EMA could prompt a search for the next support, aligning with the lower trendline of the bullish channel. This trendline coincides with Bitcoin’s 200-day EMA (the blue wave) at approximately $34,850, a level not observed since the consolidation phase in Q4, 2023.
Financial institutions are predicted to drive Bitcoin’s value down to the range of $25,000 to $30,000.
Nevertheless, analysts like Crypto Poseidonn anticipate a potential decline in Bitcoin’s price to the $25,000-30,000 range, highlighting that this is the region where many recent buyers acquired BTC.
In this scenario, those investors who purchased Bitcoin between $25,000 and $30,000 in anticipation of ETF approval may not experience significant profits, as bankers are unlikely to offer them a substantial premium over these prices.
Consequently, as Bitcoin nears the $30,000 mark, bankers may step in to buy from investors, potentially setting a new market bottom.

In the second scenario, a market correction below $25,000 might occur, providing an opportunity for new institutional investors to leverage and acquire more BTC.
Contrarily, analyst Rhaonnor contends that the Bitcoin ETF rally is already factored into the market, indicating that the range between $24,000 and $32,000 is expected to remain stable.
However, there’s dissenting opinion from trader il Capo of Crypto, who anticipates the possibility of this level cracking before reaching the ultimate price target of $12,000. The trader draws parallels to the period from 2004 to 2007 when increasing interest rates led to a market decline after the Federal Reserve’s pivot. According to il Capo, a similar situation is unfolding now.
Is it possible for Bitcoin to continue its upward trajectory?
Bitcoin’s potential for continued upward movement in the short term hinges on its ability to sustain prices above the 50-day EMA.
Forecasts from Lucas Kiely, Chief Investment Officer at Yield App, and Christos Makridis, Founder/CEO of Dynamic AI, suggest the BTC price could see further ascent towards $50,000 or $60,000 in the upcoming weeks. Interestingly, the prevailing bull pennant pattern in Bitcoin indicates a potential rally to the $50,000-60,000 range, as illustrated below.
Bull pennants, characterized by bullish continuation patterns, typically resolve with a price breakthrough above the upper trendline, reaching a height comparable to the previous uptrend.

The pattern suggests that by March 2024, the BTC price has the potential to reach $56,200. However, a breach beneath the lower trendline of the pennant would trigger the bearish targets mentioned earlier.