


Following the tweet from the compromised SEC account, Bitcoin surged towards the $48,000 range but retraced all gains, maintaining support around $45,200. The cryptocurrency exhibited a spike toward the $47,800 and $48,000 resistance levels. Presently, it is trading above $45,500 and the 100-hourly Simple Moving Average. On the hourly chart of the BTC/USD pair from Kraken, a significant contracting triangle is taking shape, with resistance near $46,800. The potential for further upward movement toward the $48,000 level persists unless a close below $45,000 occurs.
Bitcoin encounters a rejection in its price movement.
Bitcoin’s price initiated a fresh uptrend surpassing the $45,500 resistance, propelled by bullish momentum stemming from the SEC account tweet regarding ETF approval. However, a swift rejection occurred around the $48,000 zone, forming a peak at $47,988, leading to a renewed decline. The price descended below $47,000 and $46,500, reaching the support at $45,000.
A low point at $44,828 was established, and the price is currently rebounding. It has risen above the 23.6% Fibonacci retracement level of the recent drop from the $47,988 high to the $44,828 low. Bitcoin is trading above $45,500 and the 100-hourly Simple Moving Average, with a significant contracting triangle forming, featuring resistance near $46,800 on the BTC/USD pair’s hourly chart.
The immediate hurdle on the upside is around the $46,500 level, close to the 50% Fibonacci retracement level of the recent decline from the $47,988 high to the $44,828 low.
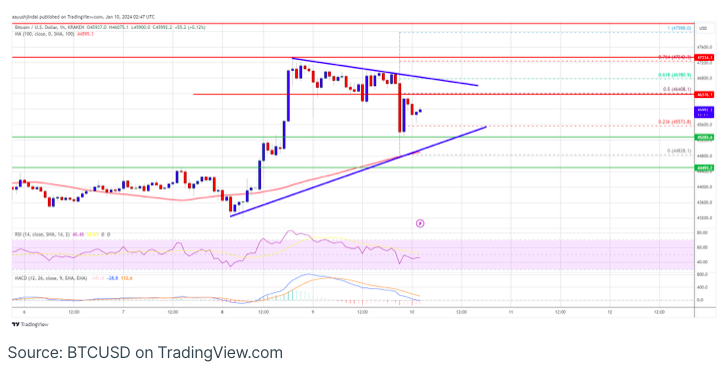
The initial significant resistance is at $46,800. A decisive breakthrough above this level has the potential to propel the price towards the $47,200 resistance. Subsequently, a new resistance is taking shape in the vicinity of the $48,000 mark. A conclusive breach beyond $48,000 could lead to further upward movement. The subsequent noteworthy resistance is positioned at $49,250.
Could Bitcoin Experience Further Declines?
If Bitcoin is unable to surpass the resistance zone around $46,800, it may initiate a fresh decline. Immediate downside support is anticipated near the $45,550 level. The subsequent significant support lies at $45,200, and a breach below this level could catalyze bearish momentum. In such a scenario, there’s a possibility of the price descending towards the nearby $44,800 support in the short term.
Technical indicators:
- Hourly MACD – The MACD is currently decelerating within the bearish zone.
- Hourly RSI (Relative Strength Index) – The RSI for BTC/USD has dipped below the 50 level.
Key Support Levels – $45,500, followed by $45,200.
Key Resistance Levels – $46,400, $46,800, and $47,200.