


Ethereum is facing challenges in surpassing the $2,300 resistance area, exhibiting bearish indicators that could lead to a potential drop towards the $2,080 support.
The struggle to overcome resistance levels at $2,280 and $2,300 persists for Ethereum.
Current trading positions are below $2,260 and the 100-hourly Simple Moving Average.
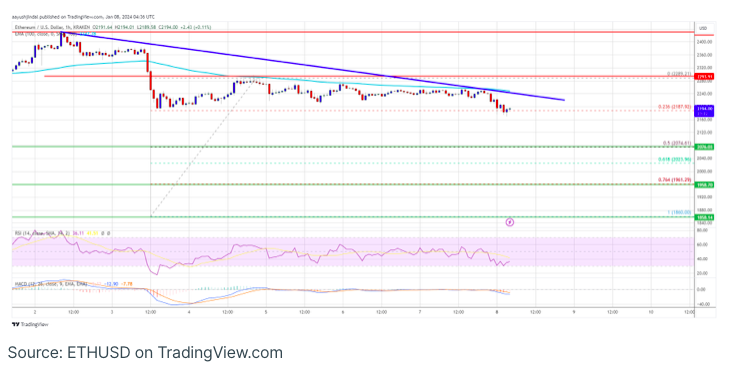
On the hourly chart of ETH/USD, a bearish trend line is forming, indicating resistance around $2,240 (data feed via Kraken).
The likelihood of further decline exists if the cryptocurrency remains below the $2,300 resistance zone.
Ethereum encounters a significant obstacle in its price trajectory.
Attempting a renewed ascent beyond the $2,200 threshold, Ethereum, much like Bitcoin, managed to surpass the $2,250 and $2,260 levels. However, encountering resistance from bears near $2,300 and the 100-hourly Simple Moving Average led to a bearish reaction.
The price peaked around $2,289, subsequently experiencing a downturn. A descent below the $2,250 level ensued, with the price trading under the 23.6% Fibonacci retracement level of the upward wave from the $1,860 swing low to the $2,289 high.
Currently positioned below $2,260 and the 100-hourly Simple Moving Average, Ethereum is marked by a forming bearish trend line with resistance around $2,240 on the hourly ETH/USD chart.
In the event of a fresh upward movement, resistance is anticipated near the $2,250 level and the trend line. The initial significant barrier lies at $2,280, followed by a more formidable hurdle at $2,300.
A breakthrough above the $2,300 resistance level may trigger a substantial upward momentum. The subsequent crucial resistance is positioned around $2,400. Should the bulls successfully propel Ethereum beyond $2,400, a potential surge towards $2,500 could ensue. Further advancements could propel the price towards the $2,620 zone.
Is Ethereum Poised for Further Declines?
If Ethereum is unable to surpass the $2,250 resistance, it may initiate a new downtrend. Initial support to the downside is situated around the $2,120 level.
The primary support level could be the $2,080 zone or the 50% Fibonacci retracement level of the upward movement from the $1,860 swing low to the $2,289 high. A breakdown and closure below $2,080 could trigger significant bearish movements. In such a scenario, Ether might test the $2,020 support, and further losses could potentially lead the price towards the $1,960 level.
As for technical indicators, the hourly MACD for ETH/USD is showing increasing momentum in the bearish zone, while the hourly RSI has dipped below the 50 level.
Key Levels:
- Major Support: $2,080
- Major Resistance: $2,280