

 signify a significant setback or serve as a prelude to a substantial price surge?")
Since December 17, 2023, the price of Shiba Inu (SHIB) has experienced a decline, with the acceleration of this decrease observed on January 3 of this year.
Despite the downturn, SHIB successfully averted a breakdown from a crucial horizontal support zone. Will its recovery persist?
Shiba Inu encounters difficulty in surpassing resistance.
The weekly chart indicates a decline in SHIB price since January 2023, remaining below a horizontal resistance zone since April. This downward trend hit a low of $0.0000060 in June.
Although Shiba Inu experienced subsequent increases, it struggled to breach the horizontal resistance zone. Instead, it faced rejection twice, marked by the formation of extended upper wicks—a sign of selling pressure.
This week, SHIB price saw a significant decline but formed a notable long lower wick (green icon) and has shown signs of recovery over the past two days.

The Relative Strength Index (RSI) serves as a momentum indicator employed by traders to assess whether a market is in an overbought or oversold condition, aiding in the decision to accumulate or sell an asset. Readings surpassing 50 in an upward trend suggest an ongoing advantage for bulls, while readings below 50 signify the opposite. The weekly RSI currently presents a mixed reading as it is declining but remains above 50.
SHIB Price Outlook: Is the Trend Favorable or Unfavorable?
Similar to the weekly timeframe, the daily perspective provides a neutral outlook due to mixed signals from both price action and the RSI.
Observing the price action, it’s evident that SHIB has been trading within an ascending parallel channel since June 2023, typically associated with corrective movements. Recent events include SHIB being rejected by the channel’s resistance trend line on December 17 (red icon), resulting in a subsequent decline.
Following the decrease, SHIB reached a low of $0.0000082 on January 3, 2024, but then experienced a rebound, preventing a breakdown below the $0.0000096 support area.
Additionally, it’s noteworthy that over 5 million tokens were burned in the last 24 hours.
Despite this rebound, the daily RSI dipped below 50, signaling a bearish trend. Consequently, whether SHIB rebounds around the $0.0000096 level or undergoes a breakdown will play a crucial role in determining the future price trend of SHIB.
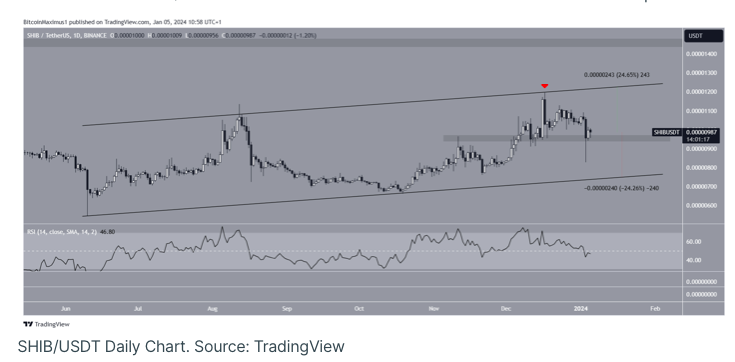
A rebound has the potential to result in a 25% upswing towards the channel’s resistance trend line, situated at $0.0000120, whereas a breakdown could precipitate a 25% decline towards the support trend line, marked at $0.0000078.