


The price of Ethereum is undergoing a correction from the $2,440 zone, currently trading below the $2,400 level. Despite the correction, bullish activity may persist near the $2,300 and $2,240 support levels. As of now, the price is holding above $2,320 and the 100-hourly Simple Moving Average, indicating potential support. On the hourly chart of ETH/USD, a bullish flag is forming with resistance around $2,360. A successful close above the $2,400 level could initiate a new upward movement for the pair.
The Ethereum price continues to find support.
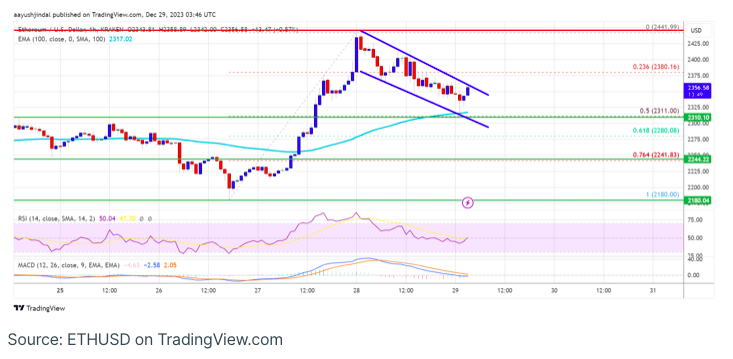
Ethereum’s price surged above the $2,320 resistance zone and surpassed the $2,400 level before encountering selling pressure, mirroring Bitcoin’s correction. After reaching a peak around $2,441, a downward correction ensued.
The price dipped below $2,400 and $2,380, testing the 50% Fibonacci retracement level of the upward movement from the $2,180 low to the $2,441 high. Notably, support appears evident around the $2,320 zone, with bullish activity observed.
As of now, Ethereum is trading above $2,320 and the 100-hourly Simple Moving Average. Resistance is evident around the $2,360 level, with a bullish flag formation visible on the hourly chart of ETH/USD, indicating potential upward momentum.
The primary hurdle lies at the $2,400 mark, and a successful breach of this resistance could propel the price towards $2,440. Subsequently, the next significant barrier is at $2,500. A decisive breakthrough above the $2,500 threshold has the potential to initiate a renewed upward movement. If this momentum persists, Ethereum could encounter resistance at $2,620, and surpassing this level might trigger a rally towards the $2,750 zone.
Could Ethereum Experience Further Declines?
If Ethereum is unable to surpass the $2,400 resistance, there is a possibility of further downward movement. Initial support on the downside is anticipated near the $2,320 level and the 100 hourly Simple Moving Average (SMA).
The primary support level could be the $2,240 zone or the 76.4% Fibonacci retracement level of the upward wave from the $2,180 swing low to the $2,441 high. A break below $2,240, followed by a close below this level, might trigger a more substantial decline. In such a scenario, Ether could test the $2,165 support, and any additional losses may lead the price toward the $2,120 level.
Looking at the technical indicators, the hourly Moving Average Convergence Divergence (MACD) for ETH/USD is showing a loss of momentum in the bullish zone. Meanwhile, the hourly Relative Strength Index (RSI) for ETH/USD is currently near the 50 level.
Key Levels:
- Major Support: $2,320
- Major Resistance: $2,400