


Ethereum’s price is surging, surpassing the $2,320 resistance zone with a gain of over 5%, indicating a potential outperformance compared to Bitcoin.
Currently, Ethereum is gaining momentum and maintaining levels above the $2,300 support zone.
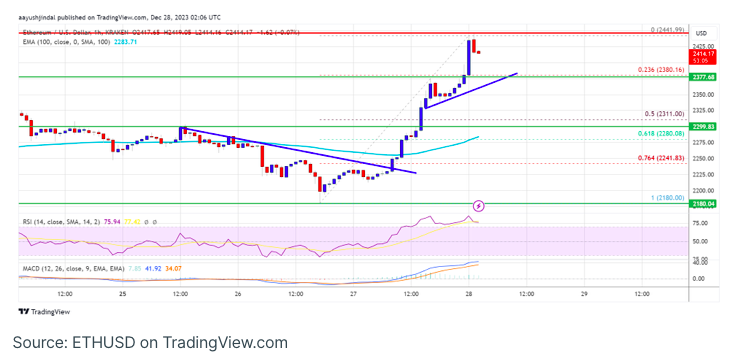
The price is trading above $2,350 and the 100-hourly Simple Moving Average.
On the hourly chart of ETH/USD (data feed via Kraken), a connecting bullish trend line is emerging, providing support around $2,380.
The pair shows the possibility of extending its rally towards the $2,500 and $2,550 resistance levels.
Ethereum initiates a new upward surge in its price.
The Ethereum price experienced a decline below the $2,250 level, with a brief dip below $2,200 before a bullish response emerged. The cryptocurrency reached a low point around $2,180 and subsequently embarked on a robust upward movement, surpassing Bitcoin in performance.
The market witnessed an upward push beyond the $2,250 and $2,280 resistance marks, and the bulls propelled the price above the $2,350 threshold. A recent multi-day high was established around $2,441, and the current phase involves consolidating these gains. The price is currently trading above the 23.6% Fibonacci retracement level of the upward trajectory from the $2,180 swing low to the $2,441 high.
Ethereum is positioned above $2,350 and the 100-hourly Simple Moving Average. On the positive side, resistance is encountered near the $2,440 level.
The initial significant resistance level is currently around $2,500. A successful breach of the $2,500 resistance might propel the price towards $2,600. The subsequent crucial resistance is situated near $2,620. A decisive breakthrough above the $2,620 threshold has the potential to trigger another upward movement. Following this, the subsequent resistance is identified at $2,700, and a successful surpassing of this level may lead Ethereum to rally and test the $2,800 zone.
Is Ethereum Poised for a Downturn Correction?
If Ethereum is unable to surpass the $2,440 resistance, it may initiate a new downward trend. Initial support on the downside is evident near the $2,380 level and the established trend line.
The primary support level could be at the $2,320 zone or the 50% Fibonacci retracement level of the upward movement from the $2,180 swing low to the $2,441 high. A breach and closure below $2,320 might trigger additional bearish movements. In such a scenario, Ethereum could revisit the $2,200 support, and further losses may lead the price towards the $2,120 level.
Technical Indicators:
- Hourly MACD – The MACD for ETH/USD is exhibiting increased bullish momentum.
- Hourly RSI – The RSI for ETH/USD has crossed above the 50 level.
Major Support Level – $2,320
Major Resistance Level – $2,440