


After a corrective phase that saw Bitcoin’s price testing the $42,650 level, BTC is making a renewed attempt at an upward movement, targeting a breach of the $43,750 resistance.
Having found support above the $42,500 region, Bitcoin has initiated a new uptrend. However, it currently trades below both $43,550 and the 100 hourly Simple Moving Average. The hourly chart for the BTC/USD pair from Kraken reveals the formation of a bearish trend line with resistance around $43,600.
To resume its upward trajectory, the pair needs to surpass key resistance levels at $43,750 and $44,300. Successfully clearing these levels could pave the way for a fresh increase in Bitcoin’s price.
Bitcoin’s price maintains stability.
Bitcoin’s attempt to breach the $44,300 resistance zone faced a setback, leading to a downward correction. The price dipped below $43,500 but found support above the $42,500 region.
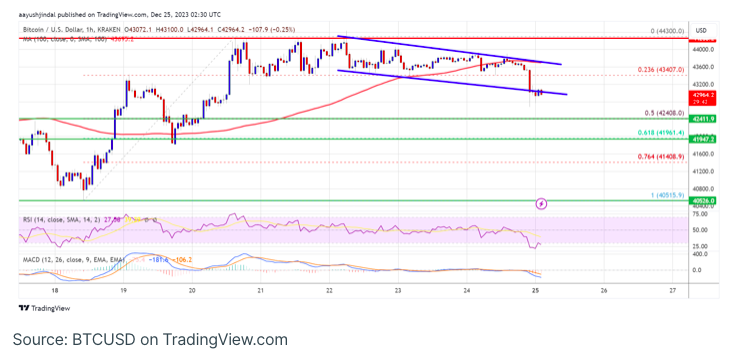
A bottom was established around $42,860, and currently, the price is making efforts to initiate a fresh uptrend. It surpassed the $43,200 resistance zone, marking a move above the 50% Fibonacci retracement level of the decline from the $44,429 peak to the $42,680 low.
Despite these positive developments, Bitcoin is still below the $43,550 mark and the 100-hourly Simple Moving Average. Additionally, a bearish trend line is taking shape with resistance approximately at $43,600 on the hourly chart of the BTC/USD pair.
This trend line closely aligns with the 61.8% Fibonacci retracement level of the drop from the $44,429 peak to the $42,680 low. Immediate resistance is noted near $43,550, with the primary hurdle forming around the trend line.
If there is a successful breach of the $43,600 resistance, it may pave the way for a substantial upward movement towards the $44,300 level. Subsequently, the following significant resistance might emerge around $45,000, and surpassing this level could propel BTC towards the $46,500 mark. Further gains beyond that point could potentially drive the price toward $47,200.
Could Bitcoin Experience Another Downturn?
If Bitcoin is unable to surpass the $43,600 resistance zone, a potential decline may ensue. Immediate support on the downside is anticipated around the $43,000 level.
The subsequent significant support lies near $42,600. Should the price fall below $42,600, there is a heightened risk of further losses. In such a scenario, the price could descend towards the $42,000 support in the short term.
Technical indicators reveal:
- Hourly MACD: The MACD is currently decelerating in the bearish zone.
- Hourly RSI (Relative Strength Index): The RSI for BTC/USD is presently near the 50 level.
Key Support Levels: $43,000, followed by $42,600.
Key Resistance Levels: $43,600, $44,000, and $44,300.