


The momentum in Bitcoin’s price is building as it surpasses the $44,000 resistance. Further upward movement is anticipated once it successfully clears the hurdles at $44,500 and $45,000.
Bitcoin initiated a notable ascent, breaking through the $43,500 resistance zone.
The price is currently above $43,500 and the 100-hourly Simple Moving Average.
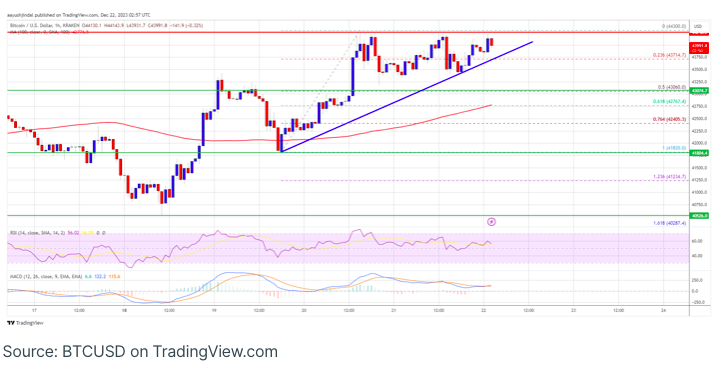
On the hourly chart of the BTC/USD pair (data feed from Kraken), a crucial bullish trend line is taking shape, offering support around $43,800.
A robust upward rally could be in the cards if Bitcoin achieves a close above the levels of $44,300 and $44,500.
Bitcoin Price Targets Further Upside
Bitcoin’s price has established a solid position above the $43,500 resistance area, entering a more bullish territory. BTC successfully overcame several obstacles and experienced an upward spike beyond the $44,000 threshold.
The $44,300 resistance zone was tested, resulting in a peak around $44,300, and the current situation involves a consolidation of these gains. Despite a minor correction below the $44,100 level, stability is maintained above the 23.6% Fibonacci retracement level of the upward movement from the $41,820 swing low to the $44,300 high.
Bitcoin is presently trading above $43,500 and the 100-hourly Simple Moving Average, with a key bullish trend line forming, providing support around $43,800 on the hourly chart of the BTC/USD pair.
Looking ahead, the immediate resistance lies near the $44,200 level, followed by more significant hurdles at $44,300 and $44,500. A decisive breakthrough above the $44,500 resistance could initiate a robust rally, potentially allowing the price to surpass the $45,000 resistance level.
The upcoming significant resistance is likely around $46,500, surpassing which Bitcoin could ascend towards the $47,200 level. Further advances may propel the price towards $48,000.
Possible Downturn Ahead for BTC?
Should Bitcoin struggle to surpass the $44,300 resistance zone, it may initiate a renewed downtrend. Immediate support on the downside can be found near the $43,800 level and the established trend line.
The subsequent significant support is anticipated around $42,750 or the 61.8% Fibonacci retracement level, calculated from the upward movement between the $41,820 swing low and the $44,300 high. A breach below $42,750 poses the risk of further losses, potentially leading the price towards the nearby $42,200 support in the short term.
Technical indicators suggest a strengthening bullish momentum, with the hourly MACD gaining traction in the bullish zone. Additionally, the hourly RSI (Relative Strength Index) for BTC/USD is now above the 50 level.
Key Support Levels: $43,800, followed by $42,750.
Key Resistance Levels: $44,300, $44,500, and $45,000.