


Ethereum’s price continues to face challenges in reclaiming the $2,250 level, especially as Bitcoin surpasses $43,500. ETH is displaying worrisome indicators, signaling the potential for a significant downturn.
The struggle persists for Ethereum to gather momentum for an upward move beyond the $2,250 resistance zone.
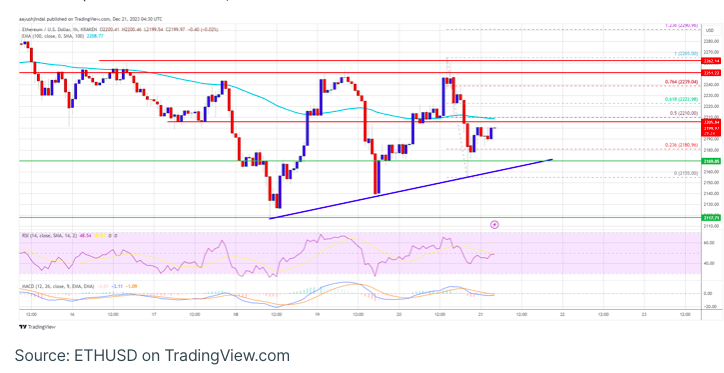
The current price is trading beneath $2,220 and the 100-hourly Simple Moving Average.
On the hourly chart of ETH/USD (data sourced from Kraken), a crucial bullish trend line is taking shape, providing support around $2,170.
Should the price linger below $2,250 for an extended period, there’s a risk of a substantial decline for the pair.
Ethereum Encounters Obstacles in Price Movement
Ethereum made a renewed attempt to surpass the $2,250 and $2,265 resistance levels. However, it was unsuccessful in establishing itself above the $2,250 resistance, facing rejection multiple times near the $2,250 and $2,265 levels.
Meanwhile, Bitcoin accelerated its movement above the $43,500 resistance, posing a potential concern for Ethereum bulls. The recent low for Ethereum was established around $2,155, and the price is currently in a consolidation phase. It has sustained a position above the 23.6% Fibonacci retracement level of the recent downturn from the $2,265 swing high to the $2,155 low.
An essential bullish trend line is taking shape, offering support near $2,170 on the hourly chart of ETH/USD. Ethereum is presently trading below $2,220 and the 100-hourly Simple Moving Average.
On the positive side, resistance is encountered near the $2,210 level, close to the 50% Fibonacci retracement level of the recent decline from the $2,265 swing high to the $2,155 low. The subsequent significant resistance lies around the $2,250 level or $2,265. A clear breakthrough above the $2,265 zone could propel the price toward the $2,320 level.
The succeeding resistance level is positioned at $2,365. Further upward momentum has the potential to initiate a surge towards the $2,450 level, surpassing which Ethereum may embark on a rally to test the $2,500 zone.
Could Ethereum Experience Further Declines?
If Ethereum is unable to surpass the $2,250 resistance, it may initiate a further decline. Initial support on the downside is anticipated near the $2,170 level and the trend line.
The primary support level could be at the $2,120 zone. A downside breach and a close below $2,120 might trigger significant bearish movements. In such a scenario, Ether could revisit the $2,000 support. Subsequent losses might propel the price towards the $1,880 level in the upcoming sessions.
Technical Indicators:
- Hourly MACD: The MACD for ETH/USD is indicating a loss of momentum in the bullish zone.
- Hourly RSI: The RSI for ETH/USD is currently below the 50 level.
Key Support Level: $2,170
Key Resistance Level: $2,250
Disclaimer: This article is provided for educational purposes only. It does not reflect the opinions of NewsBTC on whether to buy, sell, or hold any investments. Investing inherently carries risks, and it is recommended to conduct your own research before making any investment decisions. Use the information provided on this website entirely at your own risk.