


The Ethereum price faces challenges in reclaiming levels above $2,200 and $2,250. The potential for bearish momentum looms if there’s a decisive breach below the critical support at $2,120.
Ethereum is encountering obstacles in its attempt to surpass the $2,150 resistance zone.
The current price is below $2,200 and the 100-hourly Simple Moving Average.
On the hourly chart of ETH/USD (data feed via Kraken), a bearish trend line is taking shape with resistance around $2,210.
A successful breach of the $2,210 resistance could pave the way for further upward movement.
Ethereum Encounters Obstacles in Price Movement
Ethereum made an attempt to surge above the $2,200 mark, but the momentum fell short of breaking through the $2,250 resistance. The cryptocurrency reached a peak around $2,253 before initiating a fresh decline, mirroring Bitcoin’s movement.
The price dipped below $2,200, establishing a low near $2,136. Presently, Ethereum is striving for a renewed uptrend, surpassing the $2,180 level. Testing the waters, the price examined the 50% Fibonacci retracement level of the recent drop, stretching from the $2,253 peak to the $2,136 low.
As of now, Ethereum is trading beneath $2,200 and the 100-hourly Simple Moving Average. Additionally, an emerging bearish trend line is connecting with resistance at approximately $2,210 on the hourly ETH/USD chart.
Facing upward, resistance is evident near the $2,205 level, closely aligned with the 61.8% Fibonacci retracement level of the recent descent from the $2,253 high to the $2,136 low.
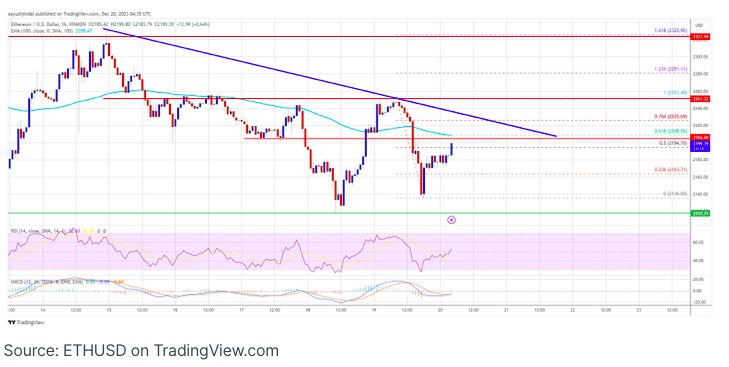
The upcoming critical resistance lies in the vicinity of the $2,220 level or the trend line. The primary hurdle remains steadfast around $2,250. A decisive breakthrough above the $2,250 zone has the potential to propel the price towards the $2,320 level. Following this, the next resistance is at $2,350. Subsequent gains may trigger a surge towards the $2,420 level, beyond which Ethereum could rally and test the $2,550 zone.
Could Ethereum Experience Further Declines?
If Ethereum is unable to surpass the $2,210 resistance, it may initiate a new downturn. Initial support on the downside is located around the $2,165 level.
The primary support level to watch is the $2,120 zone. A break below and a close beneath $2,120 could trigger another significant decline. In such a scenario, Ether might revisit the $2,000 support. Further losses could lead the price towards the $1,880 level in the days ahead.
Technical Indicators:
- Hourly MACD: The MACD for ETH/USD is showing increased momentum in the bullish zone.
- Hourly RSI: The RSI for ETH/USD has now surpassed the 50 level.
Key Levels:
- Major Support Level: $2,120
- Major Resistance Level: $2,250