


The Ethereum price has experienced a notable surge, surpassing the $2,100 level and successfully clearing the $2,200 mark. Momentum is building, raising the possibility of a further upswing beyond the $2,220 threshold.
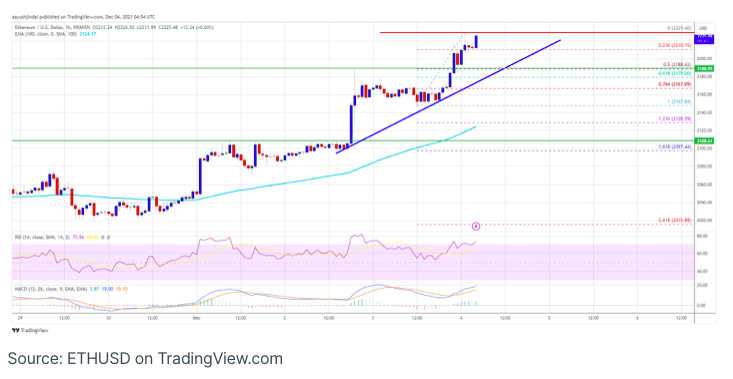
Positive indicators abound for Ethereum, as it recently conquered the $2,200 resistance. The current trading value is above $2,150, supported by the 100-hourly Simple Moving Average. On the hourly chart of ETH/USD (data feed via Kraken), a bullish trend line is emerging, indicating support around $2,190.
If the pair manages to breach the $2,220 resistance zone, there is potential for an extended rally.
Ethereum Witnesses a 5% Surge in Price.
After settling above the $2,000 mark, Ethereum’s price remained strong, gaining bullish momentum to surpass the $2,120 resistance. Similar to Bitcoin’s movement above $40,000, Ethereum experienced an upward push beyond $2,200, resulting in a new multi-month high around $2,229, with the price currently consolidating these gains.
The current trading status sees Ethereum above the 23.6% Fibonacci retracement level of the upward movement from the $2,147 swing low to the $2,229 high. Additionally, a bullish trend line is forming, providing support around $2,190 on the hourly chart of ETH/USD.
Ethereum is currently trading above $2,180 and the 100-hourly Simple Moving Average. Resistance is encountered around the $2,220 zone on the upside. The primary resistance lies near the $2,250 level, followed by a subsequent hurdle at $2,320. A decisive move above $2,320 could propel the price toward the $2,450 resistance zone.
The upcoming hurdle lies in the vicinity of $2,500, and surpassing this level might pave the way for a potential advance toward the $2,650 mark. Further gains beyond this point could initiate a bullish wave targeting the $2,800 level.
Is there support for downward price corrections in Ethereum (ETH)?
If Ethereum encounters difficulty in surpassing the $2,220 resistance, a potential downward correction could unfold. Initial support in such a scenario is situated around the $2,190 level along with the trend line.
Subsequently, the next critical support level is at $2,165, representing the 76.4% Fibonacci retracement level of the upward movement from the $2,147 swing low to the $2,229 high. The primary support now rests near $2,120. A breach below $2,120 might initiate a sustained decline, with the key support established at $2,050. A further decline below this level poses a risk of descending towards the $2,000 mark in the near term.
In terms of technical indicators, the hourly MACD for ETH/USD is gaining momentum within the bullish zone, while the hourly RSI is now positioned above the 50 level.
Critical Levels:
- Major Support: $2,165
- Major Resistance: $2,220