

")
Bitcoin struggled once more to surpass the $38,500 resistance area. Currently, BTC is in a consolidation phase above the 100-hourly Simple Moving Average (SMA) and is contemplating another upward move.
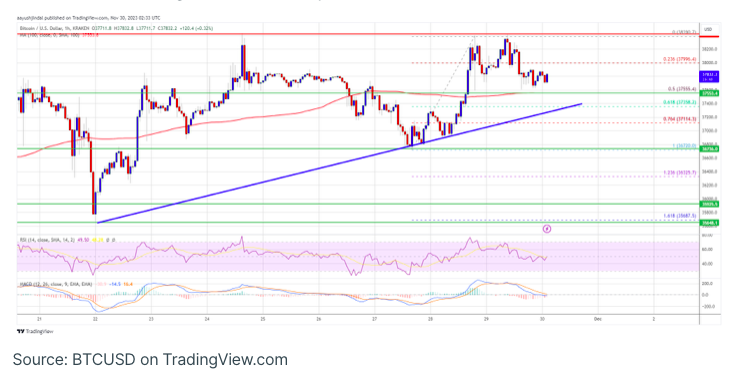
Despite encountering significant resistance around the $38,500 mark, Bitcoin’s price remains above $37,400 and the 100-hourly SMA. On the hourly chart of the BTC/USD pair (data feed from Kraken), a crucial bullish trend line is taking shape with support approximately at $37,350.
Unless the price drops below the $37,350 support, there is a possibility that the BTC/USD pair may make another effort to break through the $38,500 resistance level.
Bitcoin Maintains Support Level
The Bitcoin price continued to find strong support above the $37,500 zone. After ascending beyond the $38,000 threshold, BTC made another effort to break through the $38,400 resistance area.
Despite this, the bullish momentum faltered, resulting in a peak near $38,400. The price is currently undergoing a corrective phase, trading below the 23.6% Fibonacci retracement level of the upward movement from the $36,721 swing low to the $38,390 high.
As of now, Bitcoin is trading above $37,400 and the 100-hourly Simple Moving Average. Additionally, a significant bullish trend line is taking shape with support around $37,350 on the hourly chart of the BTC/USD pair.
Looking at potential obstacles, immediate resistance is anticipated near the $38,200 level, followed by a primary hurdle forming around $38,400. The principal resistance remains at the $38,500 level. A successful breach above the $38,500 resistance could initiate a fresh rally.
The upcoming significant resistance might be around $39,200; surpassing this level could propel BTC towards the $39,500 mark. Further gains could potentially propel Bitcoin towards the $40,000 resistance.
Could BTC Experience Further Losses?
If Bitcoin is unable to surpass the resistance at $38,400, a potential downturn may ensue. Immediate support to the downside is around the $37,550 level or the 50% Fibonacci retracement level from the upward movement spanning the $36,721 swing low to the $38,390 high.
The subsequent crucial support rests at $37,350, aligned with the existing trend line. A breach below $37,350 poses a risk of further downward movement. In such a scenario, the price might decline towards the near-term support at $36,720.
Key Technical Indicators:
- Hourly MACD: The MACD is currently decelerating within the bullish zone.
- Hourly RSI (Relative Strength Index): The RSI for BTC/USD is hovering near the 50 level.
Significant Support Levels: $37,550, followed by $37,350.
Critical Resistance Levels: $38,400, $38,500, and $39,200.