


The Bitcoin price is maintaining its position with gains above $37,000 and is presently consolidating, indicating a potential upcoming rally if it successfully surpasses the $38,000 resistance zone.
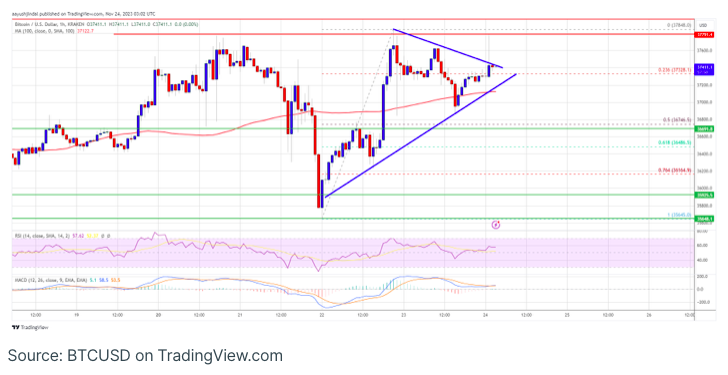
Bitcoin continues its consolidation below the $37,750 resistance, trading above $37,200 and the 100-hourly Simple Moving Average. On the hourly chart of the BTC/USD pair sourced from Kraken, there is the formation of a short-term contracting triangle with resistance near $37,420.
Should the pair manage to clear the $38,000 resistance zone, it could potentially initiate a robust upward movement.
The Bitcoin price continues to find support.
The Bitcoin price remained robust, initiating a steady uptrend above the $37,000 resistance. BTC successfully recovered from all losses and revisited the $37,750 resistance zone. However, the ongoing challenge for the bulls is to surpass this resistance, currently posing a hurdle.
A peak was reached around $37,848, and the price is currently consolidating its gains. There was a minor dip below the 23.6% Fibonacci retracement level of the upward movement from the $35,645 swing low to the $37,848 high.
Bitcoin is presently trading above $37,200 and the 100-hourly Simple Moving Average. Additionally, a short-term contracting triangle is taking shape, with resistance near $37,420 on the hourly chart of the BTC/USD pair. Immediate resistance on the upside is evident near the $37,420 level.
The primary resistance is forming around $37,750, and the main obstacle remains near the $38,000 level. A conclusive breach above the $38,000 resistance could potentially trigger a robust upward movement.
The subsequent significant hurdle might emerge around $38,800, surpassing which Bitcoin (BTC) has the potential to ascend and challenge the $39,200 level. In such a scenario, there is even the possibility of a rally towards the $40,000 resistance.
Could Bitcoin (BTC) Experience Another Decline?
If Bitcoin is unable to surpass the $37,750 resistance zone, a potential downward movement may commence. Immediate support on the downside is identified near the $37,200 level.
The subsequent major support levels include $37,000 and the 100-hourly Simple Moving Average. The primary support is situated at $36,750 or the 50% Fibonacci retracement level of the upward move from the $35,645 swing low to the $37,848 high. A breach below $36,750 poses the risk of further declines. In such a scenario, the price might descend towards the $36,000 support in the near term, with the next key support or target at $35,650.
Technical indicators show that the Hourly MACD is losing momentum in the bullish zone. However, the Hourly RSI (Relative Strength Index) for BTC/USD is currently above the 50 level.
Key Levels:
- Major Support Levels: $37,000, followed by $36,750.
- Major Resistance Levels: $37,750, $38,000, and $38,800.