


XRP has recently experienced a notable decline in the midst of current market uncertainties, dropping approximately 20% from a high of $0.736 to a low of $0.587. Despite this downturn, the use of the Fibonacci retracement tool suggests that XRP still holds potential for a bullish trajectory.
The Fibonacci retracement tool is a technical analysis tool that is used to identify potential support and resistance levels. The tool is based on the Fibonacci sequence, which is a series of numbers where each number is the sum of the two preceding numbers. The Fibonacci retracement tool is typically used to identify support and resistance levels at 23.6%, 38.2%, 50%, 61.8%, and 100% of the previous move.
In the case of XRP, the Fibonacci retracement tool suggests that the 23.6% retracement level is located at $0.634. This level is currently being tested, and if it is broken, it could open the door for a move towards the 38.2% retracement level at $0.672. If the 38.2% retracement level is also broken, it could open the door for a move towards the 50% retracement level at $0.709.
However, it is important to note that the Fibonacci retracement tool is just one tool that can be used to analyze the market. It is important to consider other factors, such as the overall market sentiment and the technical indicators, before making any investment decisions.
The recent XRP whale dump of over 51 million XRP could also have a negative impact on the price of the coin. Whales are large investors who can move the market with their trades. If a whale dumps a large amount of coins, it can cause the price of the coin to drop.
Overall, the outlook for XRP is uncertain. The coin has the potential to move higher, but it is also at risk of further losses. It is important to monitor the market closely and to make investment decisions based on your own risk tolerance.
XRP Price Could Surge to $0.80 If It Breaks Above $0.6 Resistance
The confluence of support zones at $0.6 creates a high area of interest for buyers. The formation of an inverted head and shoulder pattern could assist the coin price in resuming a bullish recovery. The intraday trading volume in XRP is $913 million, indicating a 12% loss.
The confluence of support zones at $0.6 is a strong indication that buyers are interested in buying XRP at this price level. The formation of an inverted head and shoulder pattern is a bullish technical pattern that suggests that the price of XRP is likely to resume its upward trend. The intraday trading volume in XRP is $913 million, which is a significant amount of volume. This suggests that there is a lot of interest in XRP and that the price is likely to move higher.
Overall, the outlook for XRP is positive. The confluence of support zones at $0.6, the formation of an inverted head and shoulder pattern, and the high intraday trading volume are all bullish indicators. It is likely that the price of XRP will resume its upward trend in the near future.
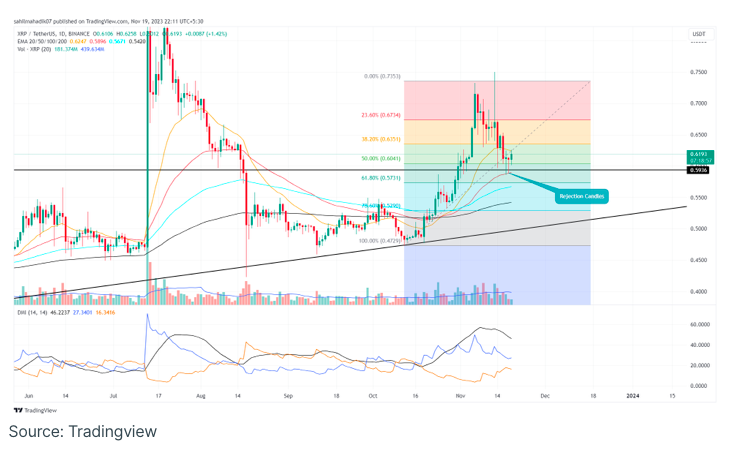
The XRP price has declined significantly in recent weeks, falling from a high of $0.736 to a low of $0.587. However, the price has found substantial support around the $0.60 level, a key psychological threshold that coincides with the 50% Fibonacci retracement level and the 50-day Exponential Moving Average (EMA).
The 50% Fibonacci retracement level is a technical analysis tool that is used to identify potential support and resistance levels. The tool is based on the Fibonacci sequence, which is a series of numbers where each number is the sum of the two preceding numbers. The 50% Fibonacci retracement level is typically used to identify support and resistance levels at 50% of the previous move.
In the case of XRP, the 50% Fibonacci retracement level is located at $0.60. This level has been tested several times in recent weeks, and it has held each time. This suggests that there is a lot of support for XRP at this price level.
The 50-day Exponential Moving Average (EMA) is a technical analysis tool that is used to identify the trend of a market. The EMA is calculated by taking the average of the closing prices of a security over a period of 50 days. The 50-day EMA is typically used as a support and resistance level.
In the case of XRP, the 50-day EMA is located at $0.60. This level has also been tested several times in recent weeks, and it has held each time. This suggests that there is a lot of support for XRP at this price level.
Overall, the outlook for XRP is positive. The price has found substantial support around the $0.60 level, which is a key psychological threshold that coincides with the 50% Fibonacci retracement level and the 50-day Exponential Moving Average (EMA). It is likely that the price of XRP will resume its upward trend in the near future.
On a longer-term scale, the weekly chart suggests that the XRP Price current recovery may be forming the right shoulder of an inverted head and shoulders pattern, typically seen as an early indication of a trend reversal. This pattern implies the potential for a significant price increase of about 48%, aiming for the neckline resistance around $0.927.
The long-term projection for XRP is still intact. In the daily time frame chart, the XRP rally throughout 2023 is traceable along an ascending trendline. The coin’s price has consistently bounced off this line over the past 11 months, indicating strong buying interest at lower levels. If the current correction breaches the $0.6 support level, the altcoin might see a further 12% decline to retest the trendline near $0.53. This moment would be crucial for traders, as either a breakdown or a rebound from this level would greatly impact its future pricing trajectory.
The 50-day Exponential Moving Average (EMA) curve around the $0.60 mark provides additional support for buyers. The Directional Moving Index (DMI) is also in a bullish crossover, reflecting a generally bullish market sentiment for XRP.
Overall, the outlook for XRP is positive. The price has found substantial support around the $0.60 level, which is a key psychological threshold that coincides with the 50% Fibonacci retracement level and the 50-day Exponential Moving Average (EMA). It is likely that the price of XRP will resume its upward trend in the near future.