

 Price Surge: Anticipating Resumption Timing")
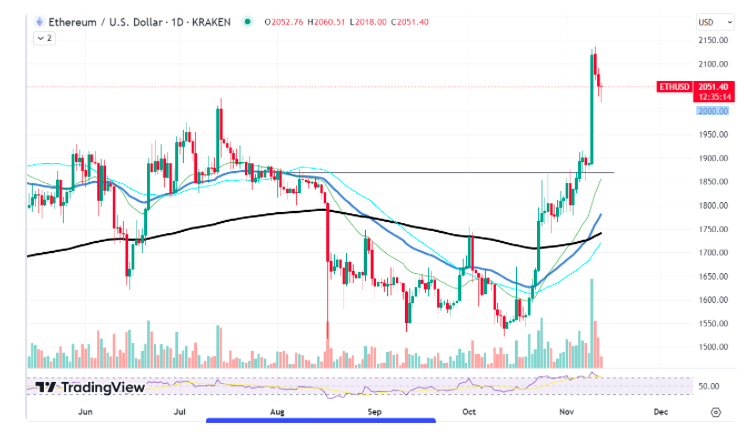
Ethereum’s recent upswing has temporarily halted, with the price of ETH stabilizing following a significant surge. This interruption prompts investors to inquire about the potential resumption of Ethereum’s price rally. Examining the chart and recent news reveals insights into potential future scenarios.
The Ethereum chart indicates a recent pullback following a rapid price increase, with the market currently in a consolidation phase. This period of stabilization is beneficial as it allows the market to establish new support levels. Notably, Ethereum’s price remains comfortably above its 50-day and 100-day moving averages, indicating an overall bullish trend. The relative strength index (RSI) has retreated from overbought levels, suggesting there may be room for another price uptick.
Optimistic Outlook
Should Ethereum sustain its support level and steer clear of dipping below the moving averages, there’s potential for a renewed upward momentum in the price. This resurgence could be propelled by growing adoption and a positive market sentiment. Keep an eye out for a tightening of Bollinger Bands, succeeded by a breakout above the upper band, indicating the initiation of another bullish phase.
Bearish scenario
On the flip side, a breach beneath the moving averages might indicate a bearish reversal. Intensified selling pressure coupled with negative market sentiment could drive the price downward. Confirmation of this potential downtrend might come from a bearish crossover on the MACD, signaling a need to prepare for a possible decline.
Recent data highlights Ethereum’s burn rate experiencing consistent growth, surpassing emissions six months post the Merge upgrade and contributing to its deflationary nature. However, on March 12, Ethereum’s daily burn rate hit a seven-month low, marking an over 89% drop from its record highs. Such fluctuations in the burn rate dynamics could impact the supply and demand economics, potentially influencing the price.
Investors should monitor the continuation of the net burn trend, as it may lead to a reduction in supply and potential price increases if demand remains stable or rises.
Shiba Inu Joins the Celebration
The meme coin craze persists, and Shiba Inu (SHIB) takes center stage with recent price movements sparking discussions about the possibility of breaching the $0.00001 threshold this week. In the midst of significant transfers by Binance, a detailed technical analysis becomes crucial to assess SHIB’s potential.
Examining the SHIB price chart reveals a substantial increase in value, as the token challenges previous resistance levels. The moving average convergence divergence (MACD) indicates a positive trend, with the blue MACD line comfortably above the signal line, signaling robust bullish momentum. While the relative strength index (RSI) isn’t in overbought territory, its upward trend toward the 70 mark suggests mounting buying pressure.
An important observation is the breach of the 50-day and 100-day moving averages, indicating a strong uptrend for SHIB. The volume bars align with the price surge, reinforcing the bullish sentiment among traders. Additionally, the expanding Bollinger Bands suggest heightened market volatility and the potential for significant price movements.
The psychological barrier of $0.00001 looms for Shiba Inu. To sustain a move above this level, SHIB must uphold its current momentum and continue to attract buying volume. A daily chart closing above this level could confirm the bullish breakout, potentially paving the way for further gains.
Recent substantial SHIB transfers by Binance add fuel to the speculative fire. Such large-scale movements may signal institutional interest or significant traders taking positions, potentially leading to substantial price swings.
The current technical configuration for SHIB holds promise, indicating the potential to reach and surpass the $0.00001 mark. However, investors should exercise caution, recognizing the inherent volatility of meme coins and their sensitivity to market sentiment. Vigilance regarding the mentioned technical indicators and monitoring news related to large transfers will be crucial in assessing whether SHIB can sustain its upward trajectory.