

 Witnessed a Massive Surge in Trading Volume: What’s the Story?")
A quick examination of Shiba Inu’s daily chart reveals a remarkable surge in trading volume, particularly in the vicinity of its current price level. This substantial uptick in trading activity has piqued curiosity and left many pondering the underlying reasons behind this sudden surge.
To comprehensively analyze this development, it’s essential to grasp the significance of trading volume in the world of cryptocurrencies. Elevated trading volume typically signifies heightened interest in a specific asset, and it can be attributed to a range of factors, including breaking news, prevailing market sentiment, or external events. A pronounced increase in volume, as evidenced with SHIB, often signifies robust buying and selling dynamics, potentially foreshadowing substantial price movements, whether they be bullish or bearish.
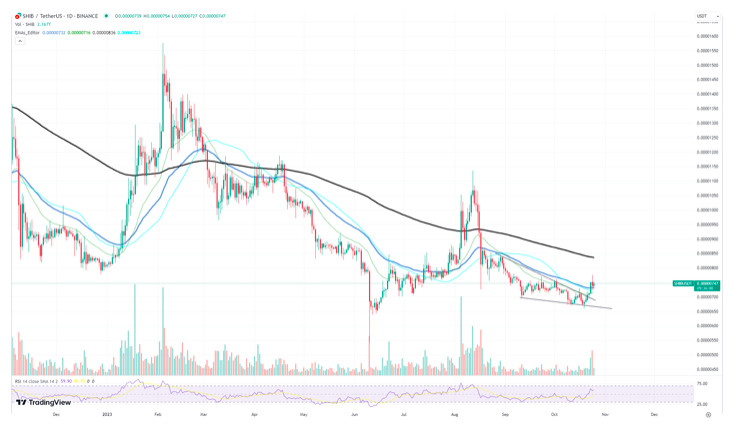
Upon scrutinizing SHIB’s chart, the conspicuous volume bars are strikingly evident. This substantial surge in trading volume indicates a heightened level of interest from both traders and investors in the token within its present price range. Such heightened activity frequently signifies a fierce battle between the bullish and bearish factions, with the asset witnessing substantial trading activity.
One plausible explanation for this dramatic volume surge may be linked to a broader upsurge in the cryptocurrency market as a whole. As the cryptocurrency space garners increased attention and draws in new participants, numerous tokens, including well-known meme coins like SHIB, inevitably see an influx of traders.
Cardano requires one final push.
Cardano’s recent price movement has captured the attention of numerous crypto enthusiasts and traders. Following initial signs of a potential extended bull run, the ADA market encountered an unexpected and rapid resistance, prompting questions about the factors behind this abrupt shift.
200 EMA Hurdle: Notably, one of the key observations revolves around Cardano’s interaction with the 200 Exponential Moving Average (EMA). As the price approached this critical resistance point, it swiftly reversed course. The 200 EMA typically exerts significant influence, particularly in the crypto market. The inability of ADA to sustain its upward momentum above this level has generated uncertainty and raised concerns among traders.
Surge in Selling Volume: Concurrent with the price reversal, there was a substantial surge in selling volume. The towering red volume bars, occurring right after reaching the 200 EMA, clearly indicate robust selling pressure at this juncture. This surge could be attributed to profit-taking by traders, concerns about resistance at the 200 EMA, or a confluence of other external factors influencing the sentiment for selling.
Multiple factors may have contributed to ADA’s sudden downturn subsequent to its encounter with the 200 EMA. First and foremost, the inherent volatility of the crypto market often leads to swift reversals following encounters with significant resistance levels. Furthermore, news or developments related to the Cardano project, macroeconomic factors, or broader market sentiment can all play a role in influencing these market dynamics.
Ethereum requires a breakthrough.
The recent price dynamics of Ethereum (ETH) indicate a potential waning of its rally. In the attached chart, several noteworthy indicators and patterns merit attention:
Moving Averages: The convergence of the blue and black moving averages typically signals a potential shift in the trend’s direction. Ethereum’s price recently moved above both moving averages, suggesting a potential shift towards a bullish trend. Nevertheless, the appearance of recent red candles suggests a pullback, likely driven by profit-taking or increased selling pressure.
Support and Resistance Levels: The chart reveals a robust resistance level around $1,780, as evidenced by the most recent candlewick touching and then retracing from this point. A convincing breach of this resistance may pave the way for Ethereum to explore higher price ranges. Conversely, the immediate support appears to be in the $1,600-$1,620 range, where prior consolidation occurred.
While predicting short-term movements with precision remains a challenge, Ethereum’s recent price action calls for caution. It’s imperative to closely monitor the $1,780 resistance level. A decisive breakthrough could lead to further upward potential, while a failure to breach it may prompt a retest of lower support levels.