


The price of Bitcoin has maintained its position above the critical $33,200 support level. BTC is on the rise and could potentially target a new upswing beyond the $35,000 resistance.
Bitcoin is once more on an upward trajectory, closing in on the $35,000 resistance mark.
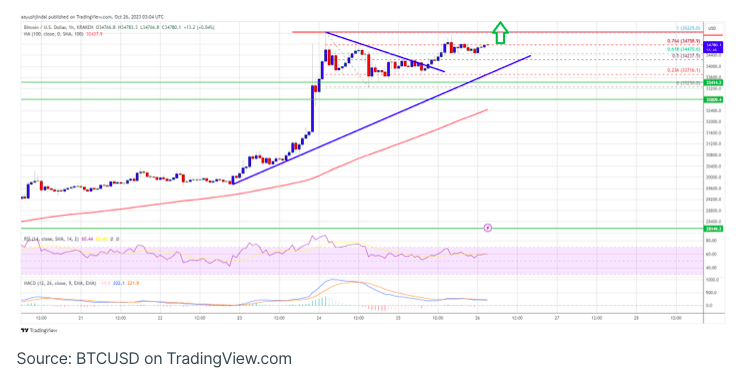
It is presently trading above $34,000 and the 100-hourly Simple Moving Average.
On the BTC/USD hourly chart (data source: Kraken), a significant bullish trend line is forming, with support around $34,220.
If there is a conclusive breach of the $35,000 resistance zone, the pair could initiate a fresh surge.
Bitcoin’s Price Sets Sights on Further Gains
The Bitcoin price underwent a correction following its approach to the $35,000 resistance zone. This correction led to a dip below the $34,200 and $34,000 levels. Nevertheless, the bulls showed activity above the $33,200 level.
A low point was established around $33,250, and the price has recently initiated a fresh ascent. Notably, it surged above the $34,000 resistance area. Furthermore, it surpassed the 50% Fibonacci retracement level of the downward movement from the $35,225 swing high to the $33,250 low.
At present, Bitcoin is trading above $34,000 and the 100-hourly Simple Moving Average. Additionally, a significant bullish trend line is taking shape, with support around $34,220 on the BTC/USD hourly chart.
Looking ahead, the immediate resistance lies near the $34,750 level or the 76.4% Fibonacci retracement level of the aforementioned downward movement from the $35,225 swing high to the $33,250 low. The next significant resistance may emerge around $35,000. The primary resistance zone to watch is currently forming near $35,200.
A decisive breach of the $35,200 barrier could initiate a fresh rally, with the next significant resistance potentially at $36,500. Further gains might propel BTC towards the $38,000 mark in the days ahead.
Could BTC Experience Another Downturn?
Should Bitcoin fail to surmount the $35,000 resistance barrier, it might initiate another downtrend. Immediate support to the downside can be found around the $34,200 level and the established trend line.
The subsequent significant support is positioned near the $33,250 level. If a breach occurs below the $33,250 support, it could give rise to further declines. In such a scenario, the price may descend toward the $31,500 level in the forthcoming sessions.
Technical indicators:
Hourly MACD – The MACD is currently gathering momentum in the bullish territory.
Hourly RSI (Relative Strength Index) – The RSI for BTC/USD is presently above the 50 mark.
Key Support Levels – $34,200, followed by $33,250.
Key Resistance Levels – $34,750, $35,000, and $35,200.