


The Dogecoin price has maintained a positive trajectory for more than a week, mirroring the trends in Bitcoin and the majority of other altcoins. Traders have been gravitating toward tokens, particularly meme coins like DOGE, which have demonstrated the potential for double-digit returns. Following a 6% surge in the past 24 hours, Dogecoin is presently trading at $0.064.
This impressive upward movement, starting from the support level at $0.0574, is primarily supported by a significant surge in trading volume, reaching $593 million, along with other bullish market indicators such as the Moving Average Convergence Divergence (MACD) and the Relative Strength Index (RSI). An analyst and trader expressed optimism on Twitter, stating, “$DOGE is a meme coin with an attractive chart structure, offering significant opportunities for the upcoming cycle!”
Analyzing the Breakout of Dogecoin’s Double-Bottom Price Pattern
The surge of interest in Dogecoin began after a prolonged downtrend that had persisted since its peak in April, when it reached $0.1. This downtrend found support at $0.0574 and coincided with the circulation of false information regarding the approval of a Bitcoin spot ETF by the U.S. Securities and Exchange Commission (SEC) early last week.
Speculation surrounding the approval of multiple Bitcoin ETFs has created waves in the market, especially after BlackRock applied to operate such a product back in June. Crypto enthusiasts are optimistic that the green light for spot Bitcoin ETFs will ignite a significant Bitcoin price rally, potentially kickstarting the next bullish trend.
Enhanced investor interest has also provided support to Dogecoin and other tokens, particularly now that it is trading above two significant moving averages: the 21-day Exponential Moving Average (EMA) represented in red and the 100-day EMA in blue.
Maintaining exposure to Dogecoin long positions is advisable as long as the MACD indicator maintains its buy recommendation. This buy signal becomes evident when the MACD line in blue crosses above the red signal line.
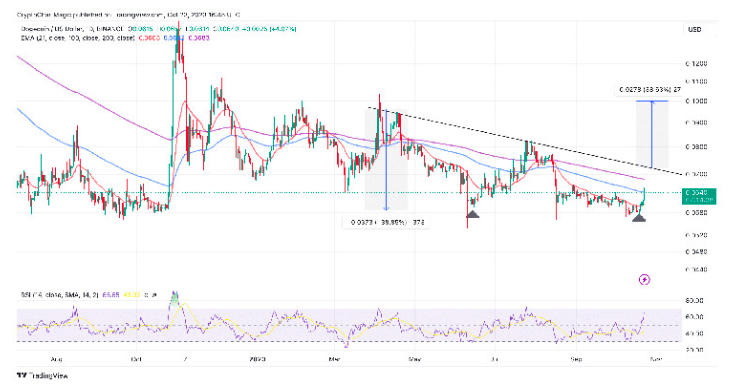
The RSI, currently at a robust level of 65, affirms the prevailing bullish momentum, significantly enhancing the likelihood of an impending breakout of the double-bottom pattern.
The double-bottom pattern, serving as a reversal signal, typically takes shape at the conclusion of a downtrend. This pattern consists of two troughs that fortify a support level tested twice, followed by an upward rebound.
In the case of Dogecoin, the ongoing uptrend stems from the double-bottom support established at $0.0574, validated in both June and October. Should the price breach the resistance at the pattern’s neckline, it would complete the formation, potentially ushering in a sharp upswing of approximately 38.85%, targeting $0.1.
The breakout target is determined by measuring the pattern’s height and extending it beyond the neckline resistance.
Traders should be watchful for several key milestones: a daily close above the immediate 100-day EMA support, a breakthrough of the 200-day EMA resistance, and subsequently surmounting the neckline barrier.
Conversely, investors might opt to exit their positions if traders decide to realize profits. A decline below the 100-day EMA support at $0.0642 could reduce the likelihood of reaching the $0.1 target, with selling pressure potentially exacerbating losses to $0.06 and revisiting the double-bottom support at $0.0574.