


The expectation was for XRP to undergo a substantial price surge in the aftermath of a favorable verdict in the legal case involving Ripple’s top executives. However, as is often the case in the cryptocurrency market, outcomes can defy anticipation, and this instance was no exception. Despite a significant legal victory for Brad Garlinghouse and Chris Larsen against the Securities and Exchange Commission (SEC), the anticipated bullish momentum for XRP turned out to be rather lackluster.
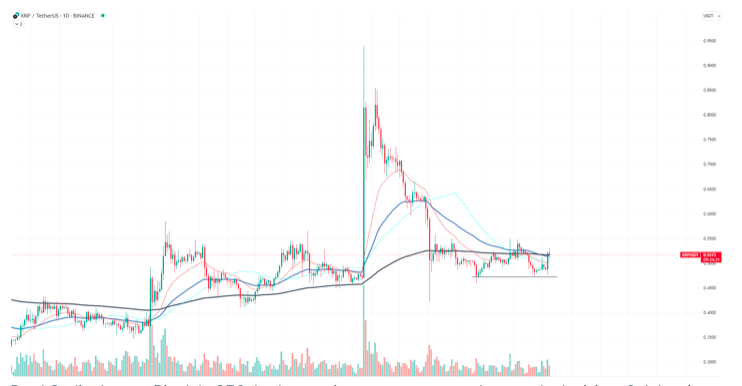
The chart paints a picture of unimpressive daily price performance for XRP. Prior to the verdict, market speculation suggested that a positive outcome would serve as the catalyst needed for XRP to not only reclaim its previous highs but potentially surpass them. Investors and traders were poised for a potential rally that, regrettably, never materialized. The price remained stagnant, lingering near its existing support levels without any significant upward movement.
Ripple’s CEO, Brad Garlinghouse, delivered an impassioned reaction to the court’s ruling. In celebration of Ripple’s triumph over the SEC, he underscored the difficulties encountered during the legal proceedings. His statement, “Today was an even better day. Ripple: 3 SEC: 0,” not only tallied their legal victories but also conveyed the strong sentiment that Ripple had been unfairly singled out. Garlinghouse accused the SEC of not only failing in its duty to safeguard consumers and businesses but also of pursuing a hostile, personal vendetta against both him and Larsen.
Solana asserts its dominance.
A recent chart analysis of Solana (SOL) clearly indicates a significant breakthrough beyond a pivotal resistance level. Such price movements are often interpreted as bullish signals, suggesting the potential for further upside.
The daily chart reveals a pattern in which SOL has repeatedly encountered resistance, impeding its upward momentum. However, the recent breakout signals a change in market sentiment. Several key observations are worth noting:
- Impressive Growth: Over the past few weeks, Solana has demonstrated strong upward momentum. The recent breakout follows a consolidation phase in which price action appeared to coil, typically a precursor to explosive moves. This sudden surge may be attributed to growing investor interest and anticipation of positive developments within the Solana ecosystem.
- Moving Averages Interaction: The interaction between short-term and long-term moving averages points to the possibility of a golden cross, a bullish signal. The short-term moving average is poised to cross above the long-term average, often attracting more buyers to the market.
- Volume Analysis: The breakout is accompanied by an increase in trading volume, underscoring the strength behind the move. High volumes during critical breakouts signify broad market consensus, reducing the likelihood of false breakouts.
Drawing a parallel with cryptocurrency giants, Ethereum’s journey in 2018-19 transformed it from a non-consensus asset to a consensus pick, solidifying its dominance in the crypto landscape. Solana appears to be on a similar trajectory. As the saying goes, “ETH was non-consensus in 18/19 but is now a consensus asset, and any informed crypto investor recognizes its quality.”
Ether falls within the domain of Bitcoin (BTC).
The perpetual rivalry among cryptocurrency giants remains a subject of intense scrutiny and debate. One of the most closely observed metrics, the ETH/BTC price chart, serves as a testament to this enduring competition. Recently, this ratio has been telling a story where Ethereum’s price performance is notably overshadowed by Bitcoin’s dominant strides in the market.
A cursory examination of the ETH/BTC chart unveils a consistent downtrend, signaling Ethereum’s diminishing value in the face of Bitcoin’s formidable presence. This trend not only mirrors the price dynamics of these two cryptocurrencies but also provides valuable insights into the broader landscape of altcoin market volatility and liquidity.
Traditionally, the ETH/BTC ratio acts as a dependable indicator of volatility and liquidity in the altcoin segment of the cryptocurrency market. An ascending ratio typically heralds an “altcoin season,” where Ethereum leads the way and outperforms Bitcoin. Conversely, a declining ratio often signifies Bitcoin’s supremacy, relegating altcoins, including Ethereum, to the background.
Bitcoin’s intrinsic qualities as a store of value, its growing adoption by institutional investors, and its limited supply are likely propelling its exceptional performance. On the other hand, Ethereum, despite serving as a robust platform for decentralized applications and smart contracts, grapples with scalability issues and an ongoing transition to Ethereum 2.0.