


Ethereum’s price has made a rebound from the $1,520 mark against the US dollar, but it is currently encountering obstacles around the $1,565 and $1,600 resistance thresholds.
Ethereum is making an effort to initiate an upward movement beyond the $1,550 level.
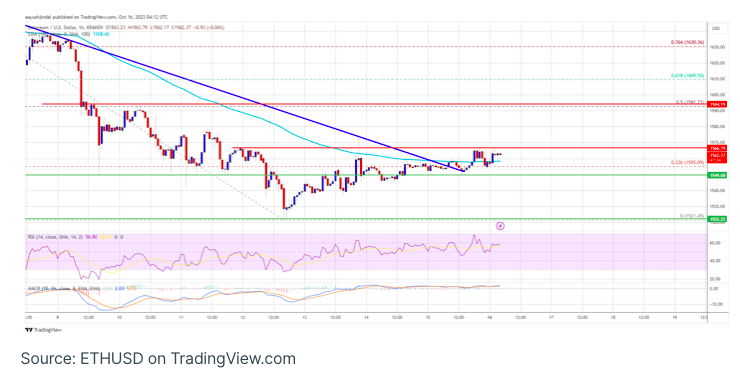
The price is currently hovering slightly above $1,550 and is positioned above the 100-hourly Simple Moving Average.
Furthermore, a significant bearish trend line was breached, which had resistance around $1,555, as observed on the hourly chart of ETH/USD (data obtained from Kraken).
However, unless there is a definitive breakthrough above $1,565 and $1,600, the pair may be at risk of another decline.
Ethereum Price Initiates a Modest Rebound
Ethereum successfully maintained its position above the $1,500 and $1,520 thresholds, establishing a short-term support base. Just as Bitcoin did, ETH has recently commenced a fresh uptick from the $1,520 range.
The price surpassed the $1,550 resistance point and ascended beyond the 23.6% Fibonacci retracement level of the primary decline from the $1,664 peak to the $1,521 low. Additionally, there was a breakthrough of a significant bearish trend line with resistance around $1,555, as indicated on the hourly chart of ETH/USD.
Ethereum is currently trading slightly above $1,550, with the 100-hourly Simple Moving Average offering support. Nevertheless, the bulls are encountering resistance in their attempts to breach the $1,565 barrier.
A clear breakthrough past the $1,565 resistance might propel Ether towards its next significant obstacle at $1,600. This level is in proximity to the 50% Fibonacci retracement level of the primary decline from the $1,664 peak to the $1,521 low. An effective breach of the $1,600 resistance could initiate a substantial uptick.
In this scenario, Ether has the potential to advance and regain ground towards the $1,665 resistance. Further gains could then pave the way for an upward move towards the $1,750 level.
Is ETH Set for Another Downturn?
If Ethereum fails to overcome the $1,565 resistance, it may trigger a new downtrend. Initial support on the downside can be found near the $1,550 level and the 100-hourly Simple Moving Average.
The subsequent significant support level stands at $1,520. A break below the $1,520 support could potentially lead to a further downward movement. In such a scenario, the price might decline towards the $1,440 level, and any additional losses could potentially push Ether down to the $1,420 level.
Technical Indicators
Hourly MACD – The MACD for ETH/USD is displaying weakening bullish momentum.
Hourly RSI – The RSI for ETH/USD is currently above the 50 level.
Key Support Level – $1,550
Key Resistance Level – $1,565