


Bitcoin’s price is currently in a consolidation phase above the $26,550 mark. While there is potential for an upward correction, any gains could be limited, with resistance likely at the $27,400 and $27,500 levels.
The cryptocurrency is seeing support around the $26,550 level, although it’s trading below both $27,200 and the 100-hourly Simple Moving Average. On the hourly BTC/USD chart provided by Kraken, a significant bearish trend line is taking shape, with resistance forming around $26,200.
While there’s a possibility of a corrective move to the upside, it’s important to note that bearish sentiments could prevail around the $27,500 region.
Bitcoin’s price maintains its support.
Bitcoin’s price initiated a fresh decline after encountering resistance at $27,500. It dipped below the $27,000 threshold, signaling a bearish trend. However, the bulls came to the rescue near the crucial support level of $26,500.
The $26,550 level remained strongly supported, with bears making two unsuccessful attempts to breach it. A low point was established at around $26,551, and the price is currently in a consolidation phase, hovering below the 23.6% Fibonacci retracement level of the downward trajectory that extended from the $28,285 peak to the $26,551 low.
At present, Bitcoin is trading beneath $27,200 and the 100-hourly Simple Moving Average, further underlining the bearish sentiment. Moreover, an important bearish trend line is taking shape, featuring resistance approximately at $26,200 on the hourly chart of the BTC/USD pair.
Immediate resistance is located near the $26,950 level, with the primary hurdle being the $27,200 level in conjunction with the 100-hourly Simple Moving Average. Subsequently, the next significant obstacle appears at $27,400, coinciding with the trend line and closely aligning with the 50% Fibonacci retracement level of the descent from the $28,285 peak to the $26,551 low.
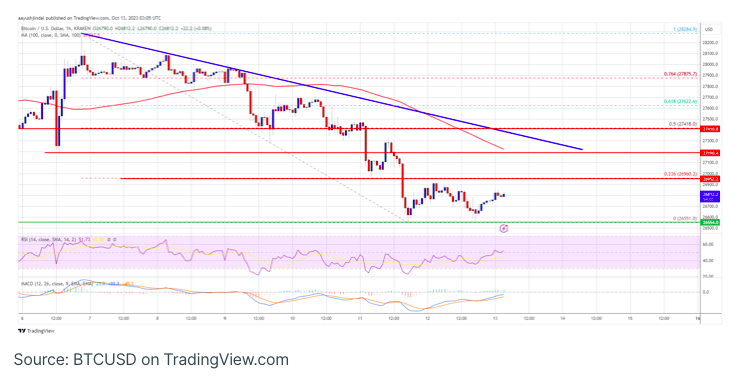
If the price manages to surpass the $27,500 resistance, it could pave the way for a gradual ascent toward the $28,000 mark. The primary challenge, however, remains at $28,500, and breaking past this level might trigger another upward trajectory. Under such circumstances, there is potential for the price to ascend towards the $30,000 resistance.
More Losses In BTC?
In the event that Bitcoin’s attempts to climb above the $27,200 resistance prove unsuccessful, the potential for further losses becomes evident. Immediate downside support is in close proximity, situated around the $26,550 level.
Subsequently, the subsequent major support is positioned near the $26,500 level. A downside breach and a subsequent close below the $26,500 support could exacerbate the price decline, potentially leading to further downward movement. The following support level to watch for then is at $26,000.
Key Technical Indicators:
- Hourly MACD: The MACD presently indicates a diminishing bearish momentum.
- Hourly RSI (Relative Strength Index): The RSI for BTC/USD has now crossed above the 50 level.
Primary Support Levels: $26,550, followed by $26,500.
Primary Resistance Levels: $27,200, $27,400, and $27,500.