


XRP’s price initiated a fresh descent after encountering resistance at the $0.550 level against the US Dollar. This decline could gain momentum and lead to a retest of the $0.45 support.
Ripple’s token value is currently retreating following its rejection at the $0.550 resistance against the US dollar.
The price is presently trading above the $0.500 mark and remains above the 100 simple moving average (4 hours).
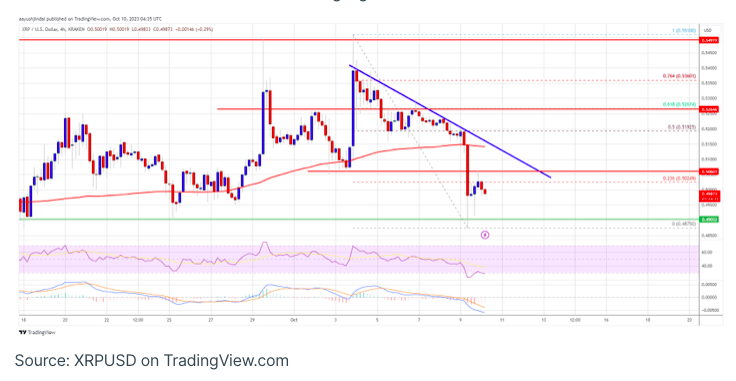
On the 4-hour chart of the XRP/USD pair (data sourced from Kraken), a significant bearish trend line is forming, indicating resistance in the vicinity of $0.5065.
If the price breaches the $0.488 support zone, there’s potential for further downward movement.
XRP Price Experiences a Setback
XRP recently attempted to breach the $0.550 resistance but faced resistance, mirroring the trend seen in Bitcoin and Ethereum.
Following this, a gradual decline unfolded, with XRP slipping below key levels such as $0.532, $0.525, $0.50, and the 100 simple moving average (4 hours). Ultimately, it revisited the $0.488 support area, forming a low near $0.4875 before consolidating its losses.
As of now, XRP is trading above $0.500 and the 100 simple moving average (4 hours). Additionally, a notable bearish trend line is emerging on the 4-hour chart of the XRP/USD pair, showing resistance around $0.5065. This trend line coincides with the 23.6% Fibonacci retracement level of the recent decline, stretching from the $0.5510 swing high to the $0.4875 low.
Looking ahead, immediate resistance lies around the $0.505 level and the mentioned trend line. A close above $0.505 may pave the way for a potential move towards the $0.525 resistance or the 61.8% Fibonacci retracement level of the recent drop from the $0.5510 swing high to the $0.4875 low.
If the $0.525 resistance level is convincingly breached, it could trigger a robust upswing towards the $0.550 resistance. Further upward momentum may propel XRP towards the $0.580 resistance.
More Losses?
Should XRP fail to overcome the $0.505 resistance zone, a continuation of its downward trajectory may ensue. Initial support on the downside is situated around the $0.488 area.
The subsequent significant support level rests at $0.450. In the event of a downward breakthrough and a close below the $0.450 mark, the XRP price could shift into a bearish phase. Under such circumstances, there is the possibility of a retest of the $0.420 support zone.
Technical Indicators:
- 4-Hour MACD – The MACD indicator for XRP/USD is presently losing momentum within the bearish region.
- 4-Hour RSI (Relative Strength Index) – The RSI for XRP/USD has dipped below the 50 level.
Key Support Levels: $0.488, $0.465, and $0.450.
Key Resistance Levels: $0.505, $0.525, and $0.550.