


The price of Bitcoin (BTC) experienced a sudden surge, revisiting the $28,000 mark, buoyed by robust US labor market data for September. As reported by the Bureau of Labor Statistics (BLS), payroll employment saw a substantial increase of 336,000 in September, while the unemployment rate held steady at 3.8%.
BTC’s Response to US Data
The release of positive employment data might prompt the FOMC to adopt a more hawkish stance at its upcoming November meeting. However, greater clarity on the Fed’s interest rate decision for November could emerge with the release of the September Consumer Price Index (CPI) data on October 12.
In a recent analysis of BTC price movements, an accurate prediction was made of an upward movement above $28,000, followed by a pullback towards $27,500, attributed to liquidity effects. BTC has demonstrated a tendency to revisit price imbalances or liquidity zones. Since October 2, buyers have been utilizing the price volatility range between $27,000 and $27,200 to re-enter the market.
The recent rejection occurred at the previous low of $28,500, dating back to early August. Beyond this level, there exists another price volatility range between $28,700 and $29,000, acting as a constraint. The daily decline of the order book (OB) extends from $29,000 to $30,400.
Therefore, in the event that Thursday’s CPI data favors the bullish side, it is conceivable that BTC may retest the specified resistance levels at $28,500, $29,000, or $29,500. Conversely, it is suggested that the bulls may defend the price imbalances and the demand area between $27,000 and $27,200.
A decline below the $27,000 level, particularly if the September CPI data favors sellers, has the potential to weaken BTC to $26,400 or the daily uptrend OB. Moreover, while the Relative Strength Index (RSI) indicates positive buying pressure, the On-Balance Volume (OBV) suggests recent volatility in spot market demand over the past few days.
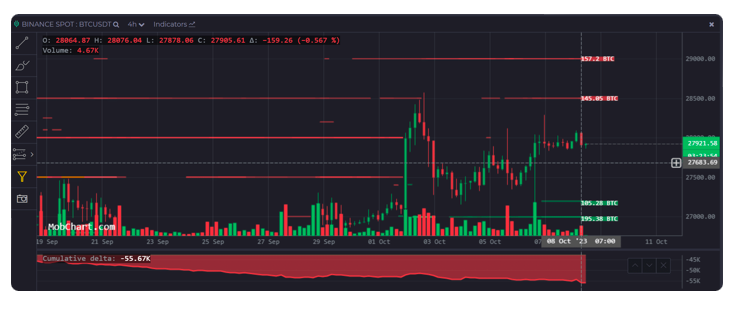
On-Chain Data for Bitcoin (BTC)
Additionally, the Chaikin Money Flow (CMF) indicates that capital inflows into the BTC market have remained subdued, consistently staying below zero. Order flow analysis, derived from MobChart data, suggests that BTC might encounter significant price reactions at levels such as $28,500, $29,000, or $29,500, where substantial sell limit orders have been observed. For instance, at the time of writing, Binance Exchange alone featured sell limit orders of 145 BTC at $28,500 and 157 BTC at $29,000.
Conversely, buy limit orders were identified at the $27,200 and $27,000 levels. Information from Coinglass’ Liquidation Map indicates that these buy and sell limit order levels align with fundamental liquidity points. Consequently, it is anticipated that BTC price fluctuations may occur within the range of $27,000, $28,000, and $29,000 in the coming days.