

 Regain the $0.07 Mark? This Chart Pattern Offers Valuable Insight")
In the midst of the prevailing bearish sentiment in the cryptocurrency market, Dogecoin’s price retreated from the weekly resistance level at $0.064 on October 2nd. This subsequent pullback resulted in a 4.7% decline over the last five days, bringing the coin’s current price to $0.061. The lingering question now is whether the increased selling pressure will prolong the correction, or if DOGE will maintain its range-bound movement.
Can the Recently Discovered Rebound Reach $0.07?
The DOGE price is expected to maintain its lateral movement until the rectangle pattern remains intact.
If a bullish breakout occurs beyond the $0.064 resistance level, it could potentially lead to a 7% increase in the coin’s price.
With a 24-hour trading volume of $104 million, Dogecoin has seen a 7% decline in its value.
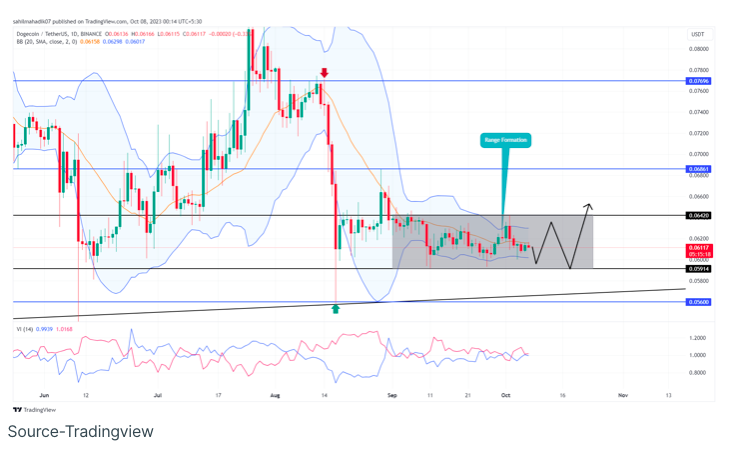
Over the past five weeks, the DOGE price has primarily fluctuated within a clearly defined range, with levels between $0.064 and $0.059. This sideways movement has witnessed numerous bounces from both support and resistance levels, underscoring the resilience of this trading range.
Nonetheless, if the bulls can gather sufficient momentum to convincingly breach the $0.064 resistance and secure a confirmed daily close above it, this may boost trader confidence for potential further gains. Breaking out of this range could potentially drive the DOGE price up by around 7%, aiming for the $0.068 level, followed by subsequent targets at $0.079.
Performance Comparison Between DOGE and SHIBA
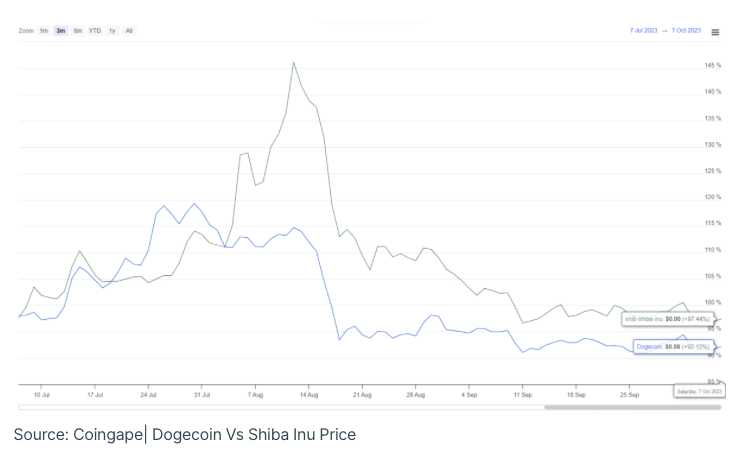
In a comparative analysis, Dogecoin has exhibited relatively stable price dynamics over the past three months, especially when contrasted with the substantial decline observed in Shiba Inu’s price. Although both of these meme coins currently hover near their monthly lows, Dogecoin’s comparatively resilient performance in the face of market turbulence positions it favorably for a potential bullish resurgence.
Analysis of Key Indicators:
- Vortex Indicator: The frequent crossovers between the VI+ (blue) and VI- (pink) slopes indicate a degree of uncertainty among market participants.
- Exponential Moving Average: The fact that the coin’s price is trading below the daily EMAs (20, 50, 100, and 200) signifies a prevailing bearish trend in the overall market.
- Bollinger Band: The narrow range observed in the Bollinger Band Indicator suggests high volatility in this asset.