


Bitcoin’s price continued its ascent, reaching the $28,500 resistance level. However, it underwent a correction and is presently maintaining a crucial support level at $27,350.
BTC extended its upward trajectory, surpassing both the $28,000 and $28,200 resistance thresholds.
The price is currently trading above $27,400 and remains above the 100-hourly Simple Moving Average.
On the hourly chart of the BTC/USD pair, a significant bullish trend line is taking shape, offering support near $27,400 (data sourced from Kraken).
Unless there is a breach of the $26,650 support, the pair could initiate another upward move.
The Bitcoin price continues to find support.
The Bitcoin price initiated a notable uptrend, breaking above the $27,200 resistance area. BTC continued its ascent steadily, surpassing both the $27,500 and $28,000 resistance levels.
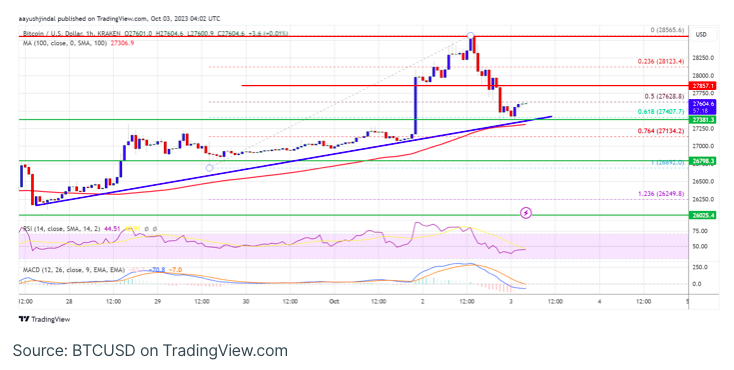
The price even tested the $28,500 resistance, reaching a new multi-week high around $28,565 before experiencing a downward correction. Subsequently, it dipped below the $28,200 and $28,000 levels, and it breached the 50% Fibonacci retracement level of the upward movement from the $26,690 swing low to the $28,565 high.
Despite these corrections, Bitcoin is still trading above $27,400 and the 100-hourly Simple Moving Average. Furthermore, on the BTC/USD hourly chart, a significant bullish trend line is taking shape, providing support in the vicinity of $27,400.
In terms of immediate resistance on the upside, it’s located near the $27,850 level. The next crucial resistance may be found around the $28,000 mark. A decisive breakthrough above the $28,000 resistance could trigger another upward surge.
In this scenario, the price has the potential to ascend towards the $28,500 resistance. Further upward momentum could potentially lead to a move towards the $29,200 level.
Could Bitcoin Experience Further Declines?
Should Bitcoin fail to sustain its upward momentum beyond the $28,000 resistance, there is potential for further downward movement. Immediate support to the downside can be found around the $27,400 level, as well as along the trend line.
The next significant support level lies near $27,250 or the 100 SMA (Simple Moving Average). A break below and a close below the $27,250 level might pave the way for the price to test $26,800, with the subsequent support resting at $26,650. If the bearish trend persists, a further decline could lead to a test of $26,000.
Technical indicators:
- Hourly MACD: The MACD is currently showing a loss of momentum within the bullish zone.
- Hourly RSI (Relative Strength Index): The RSI for BTC/USD has dipped below the 50 level.
Key Support Levels: $27,250, followed by $26,650.
Key Resistance Levels: $28,000, $28,500, and $29,200.