


The Ethereum price is making a new attempt to climb above $1,650 against the US Dollar. ETH might gain momentum if it successfully breaches the $1,670 resistance.
Ethereum is currently endeavoring to rise above the $1,620 mark.
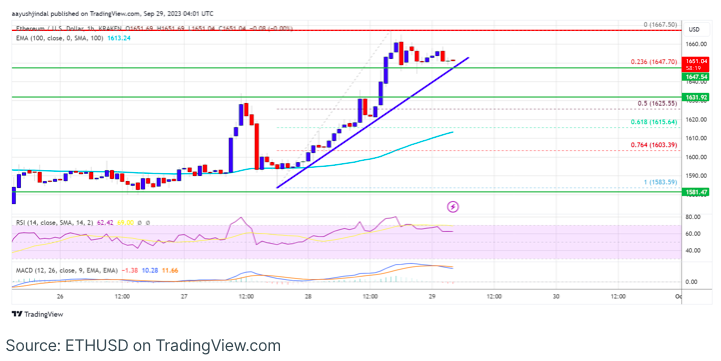
The price is trading above $1,620 and remains above the 100-hourly Simple Moving Average.
On the hourly ETH/USD chart (data feed via Kraken), there is a significant bullish trend line emerging, providing support around $1,645.
If the pair manages to surpass the $1,670 resistance area, it could potentially sustain its upward trajectory.
Ethereum’s Price Ascends Further.
Ethereum’s price established a foundation above the $1,580 mark, maintaining stability and subsequently surpassing the $1,620 resistance zone, thus entering a positive trajectory, akin to Bitcoin’s movement.
Although there was an advance beyond the $1,650 threshold, the upward potential was somewhat constrained. The peak reached approximately $1,667 before experiencing a minor corrective pullback. At present, the price hovers around the 23.6% Fibonacci retracement level of the upward journey from the $1,583 low to the $1,667 high.
Ethereum is currently trading above $1,640, maintaining its position above the 100-hourly Simple Moving Average. Furthermore, an important bullish trend line is forming, providing support in the vicinity of $1,645 on the hourly ETH/USD chart.
Regarding potential upward movement, the price could encounter resistance around the $1,670 mark. Subsequently, the next significant hurdle emerges at $1,720. A decisive breakthrough above the $1,720 resistance region could establish the groundwork for a more substantial upswing. In such a scenario, the price might target the $1,800 resistance level, with the subsequent notable resistance likely situated at $1,820. Further gains could potentially pave the way for an advance toward $1,880.
Are Dips Limited in ETH?
Should Ethereum fall short of surmounting the $1,670 resistance, a potential downside correction might ensue. The initial support to watch on the downside is situated around the $1,645 level, aligned with the established trend line.
Subsequently, the next crucial support level stands at $1,620. If this level fails to hold, there’s a possibility of the price testing the $1,600 support. Should a downward breach occur beneath the $1,600 mark, it could initiate a fresh bearish phase. In such a scenario, the price may experience a decline toward the $1,540 level.